Technical Analysis #C-COTTON : 2018-07-02

Estimates of higher supply bearish for cotton prices
USDA estimates increasing cotton planting in 2018/19. Will the cotton price continue declining?
The International Cotton Advisory Committee estimates that high 2017/18 season cotton prices are expected to result in moderate growth in global planting for 2018/19, which starts in August. The planted cotton area in US is expected to increase due to new support policies for the crop, expanding by 11% to 5.08m hectares in 2018/19. Cotton price is supported by strong Chinese demand for the crop, and China has decided to extend its reserve auction to sell cotton stocks by one month through September. And the US Department of Agriculture current forecast suggest that ending stocks outside of China will increase in 2018/19, which will help offset rising Chinese demand. Forecasts of increasing cotton planting area are bearish for cotton prices.
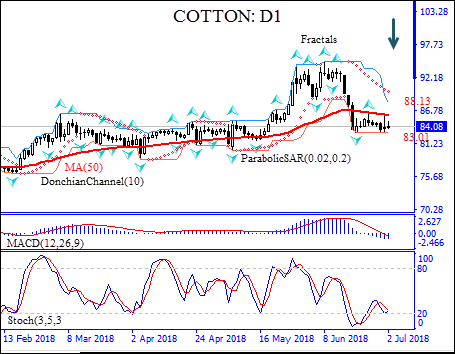
On the daily timeframe the COTTON: D1 is below the 50-day moving average MA(50) which is falling, this is bearish.
-
The Parabolic indicator gives a sell signal.
-
The Donchian channel indicates downtrend: it is tilted lower.
-
The MACD indicator gives a bearish signal: it is below the signal line and the gap is narrowing.
-
The Stochastic oscillator failed to breached into the oversold zone, it is rising but has not reached the overbought zone.
We believe the bearish momentum will continue after the price breaches below the lower boundary of Donchian channel at 83.01 This level can be used as an entry point for placing a pending order to sell. The stop loss can be placed above the upper Donchian boundary at 88.13. After placing the order, the stop loss is to be moved every day to the next fractal high, following Parabolic signals. Thus, we are changing the probable profit/loss ratio to the breakeven point. If the price meets the stop loss level (83.01) without reaching the order (88.13), we recommend cancelling the order: the market has undergone internal changes which were not taken into account.
Technical Analysis Summary
|
Position |
Sell |
|
Sell stop |
Below 83.01 |
|
Stop loss |
Above 88.13 |
Want to get more free analytics? Open Demo Account now to get daily news and analytical materials.
Want to get more free analytics? Open Demo Account now to get daily news and analytical materials.
Author

Dmitry Lukashov
IFC Markets
Dimtry Lukashov is the senior analyst of IFC Markets. He started his professional career in the financial market as a trader interested in stocks and obligations.


