Technical Analysis #C-COPPER: 2019-02-19

Two copper companies have suspended their operation in India and Indonesia
The Supreme Court of India overturned the National Green Tribunal’s decision to resume the operation of copper smelter owned by the British company Vedanta. Will Copper prices rise?
India accounts for a little more than 2% of smelted copper in the world. There are also other factors contributing to the growth of quotations. The success of the US-China trade negotiations can minimize the risks of trade wars and thus, contribute to the development of the global and Chinese economies. China published positive macroeconomic data on the increase in the volume of new yuan loans in January 2019, as well as inflation and a positive trade balance. China consumes more than 40% of the world's copper, therefore, the price of this metal reacts to Chinese statistics. The license of one of the subsidiary companies of the copper producer in Indonesia Freeport McMoRan for the export of the metal mined at the Grasberg mine has expired. It may take time to obtain a new license.
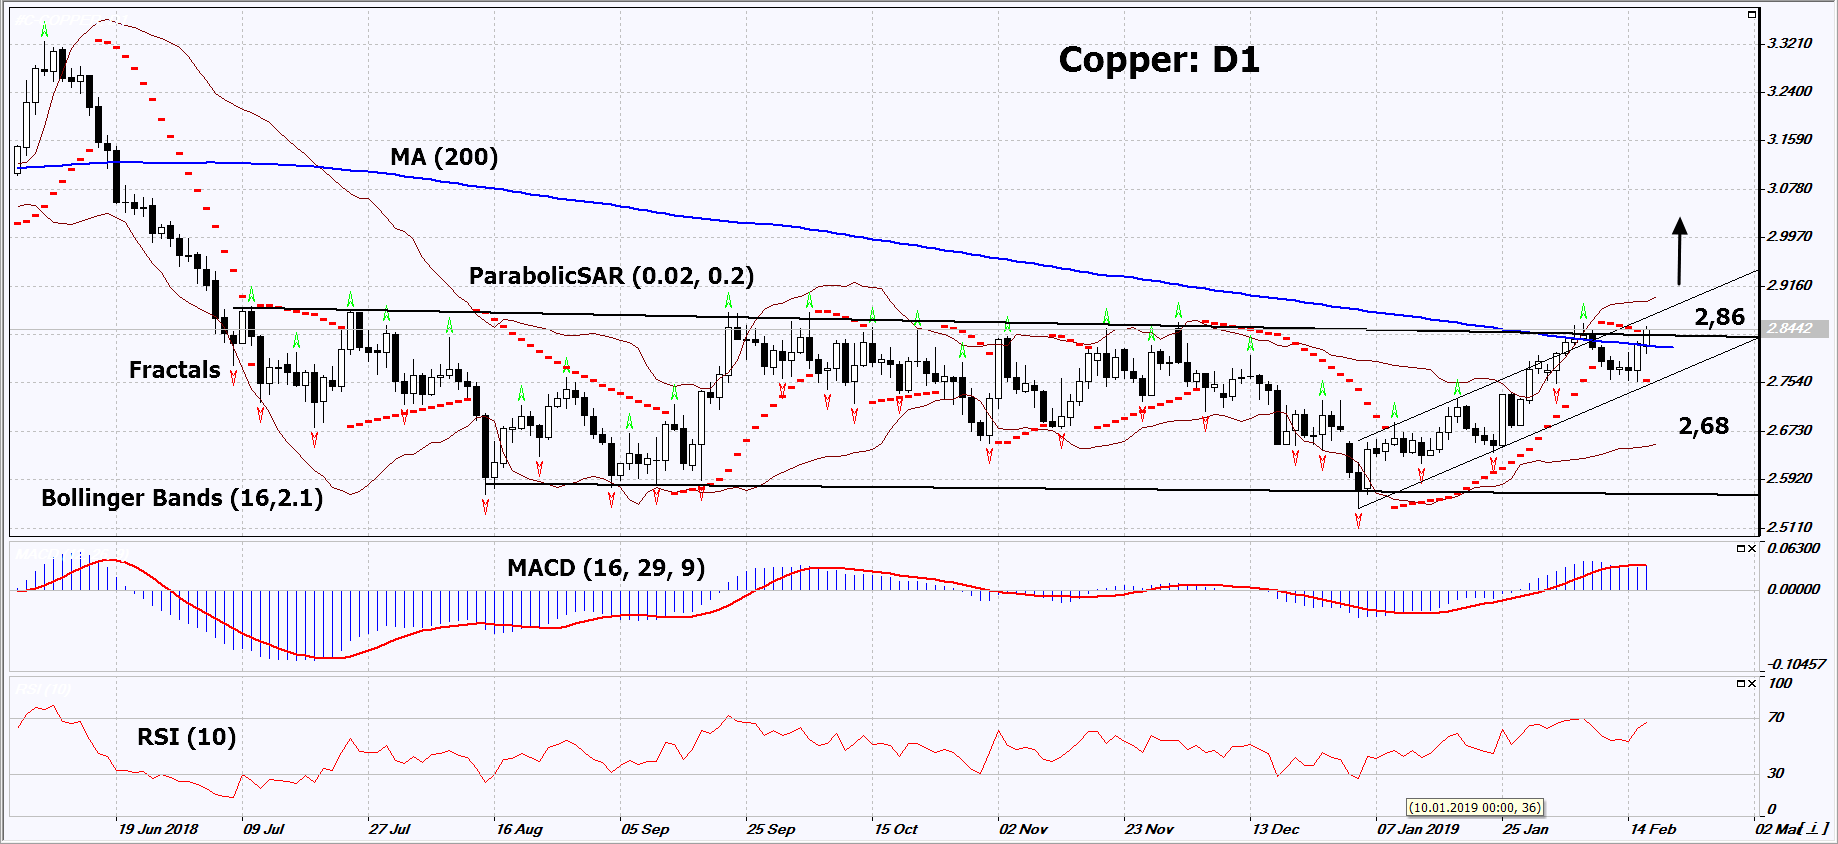
On the daily timeframe, Copper: D1 has breached up the resistance line of the neutral trend and is forming a new uptrend. A number of technical analysis indicators formed buy signals. Quotations are above the 200-day average line. Their further growth is possible in case of a reduction in world production while maintaining high demand in China.
-
The Parabolic Indicator gives a bullish signal.
-
The Bollinger bands have widened, which indicates high volatility. Both Bollinger bands are titled upwards.
-
The RSI indicator is above 50. No divergence.
-
The MACD indicator gives a bullish signal.
The bullish momentum may develop in case Copper exceeds the last fractal high at 2.86. This level may serve as an entry point. The initial stop loss may be placed below the last fractal low, the Parabolic signal and the lower Bollinger band at 2.68. After opening the pending order, we shall move the stop to the next fractal low following the Bollinger and Parabolic signals. Thus, we are changing the potential profit/loss to the breakeven point. More risk-averse traders may switch to the 4-hour chart after the trade and place there a stop loss moving it in the direction of the trade. If the price meets the stop level (2.68) without reaching the order (2.86), we recommend to close the position: the market sustains internal changes that were not taken into account.
Summary of technical analysis
|
Position |
Buy |
|
Buy stop |
Above 2.86 |
|
Stop loss |
Below 2.68 |
Want to get more free analytics? Open Demo Account now to get daily news and analytical materials.
Want to get more free analytics? Open Demo Account now to get daily news and analytical materials.
Author

Dmitry Lukashov
IFC Markets
Dimtry Lukashov is the senior analyst of IFC Markets. He started his professional career in the financial market as a trader interested in stocks and obligations.


