Technical Analysis #C-COPPER : 2017-04-21

Increasing output is bearish for copper prices
Copper supply is increasing as two major mine disruptions ended, while China’s construction growth slows. Will copper prices continue declining?
The end of copper production disruption in two major mines has increased the global copper supply, pressuring prices. A 43 day strike at Escondida mine in Chile has ended, and a temporary compromise on export shipments should allow the Grasberg mine in Indonesia to restore output to normal rates. Another negative impact for copper prices were data published by National Bureau of Statistics of China on Tuesday: growth in China’s construction industry slowed to 5.3% in the Q1 2017 from 5.9% at the end of last year and has decelerated for four straight quarters, despite rising investment in infrastructure and the real estate industry. Continued slowing of construction in world’s biggest consumer of copper is bearish for the copper price.
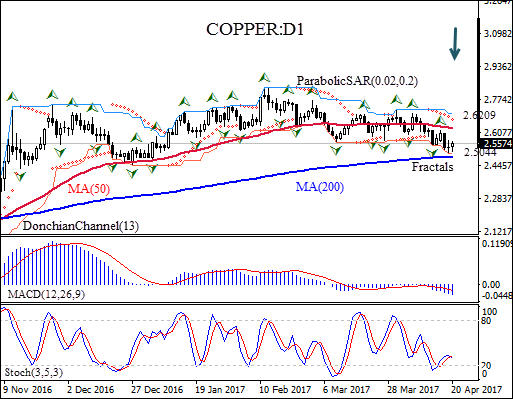
On the daily timeframe COPPER:D1 has fallen below the 50-day moving average MA(50) toward the 200-day moving average MA(200).
-
The Parabolic indicator has formed a sell signal.
-
The Donchian channel indicates no certain trend: no slope has developed yet.
-
The MACD indicator is below the signal line and the gap is widening, which is a bearish signal.
-
The stochastic oscillator is falling but hasn’t reached the oversold zone.
We believe the bearish momentum will continue after the price closes below the lower bound of the Donchian channel at 2.5044. It can be used as an entry point for a pending order to sell. The stop loss can be placed above the last fractal high at 2.6209. After placing the order, the stop loss is to be moved every day to the next fractal high, following Parabolic signals. Thus, we are changing the probable profit/loss ratio to the breakeven point. The most risk-averse traders may switch to the 4-hour chart after the trade and place there a stop-loss moving it in the direction of the trade. If the price meets the stop loss level(2.6209) without reaching the order(2.5044), we recommend cancelling the position: the market sustains internal changes which were not taken into account.
Technical Analysis Summary
| Position | Sell |
| Sell stop | Below 2.5044 |
| Stop loss | Above 2.6209 |
Want to get more free analytics? Open Demo Account now to get daily news and analytical materials.
Author

Dmitry Lukashov
IFC Markets
Dimtry Lukashov is the senior analyst of IFC Markets. He started his professional career in the financial market as a trader interested in stocks and obligations.


