Technical Analysis #C-COFFEE : 2017-01-09
World coffee exports increased in 2016-17 season start
According to the International Coffee Organization (ICO), world coffee exports increased by 13, 6% to 9, 94 million bags of 60 kilograms in November of the last year. Will coffee prices continue rising?
The increase in world exports indicates about the increase in demand for coffee from rich countries where it does not grow. In the first two months of the 2016/17 agricultural season, which started from October 1, 2016, global exports rose by 8,5% compared to the 2015/16 season and amounted to 19,52 million bags. Of this volume, the supply of Arabica coffee on the world market increased by 7, 9% and in October-November – by 7, 3% to 12, 48 tonnes. Robusta exports increased by 24, 9 % in November and in 2 months – by 10, 8%. Note that in the world production, the share of Robusta is 36%, while Arabica makes up the rest. An additional factor in favor of the growth of coffee prices was the announcement of Indonesia on the possible reduction of bean production in the current year by 637,5 thousand tonnes compared to 639,3 thousand tonnes in 2016. In addition, Vietnamese farmers have increased the cost of Robusta coffee in anticipation of the Lunar New Year, which will be celebrated from January 26 to February 1, 2017. Domestic prices have increased by almost 35% compared to the last year and reached approximately 46,200 VND per kilogram.
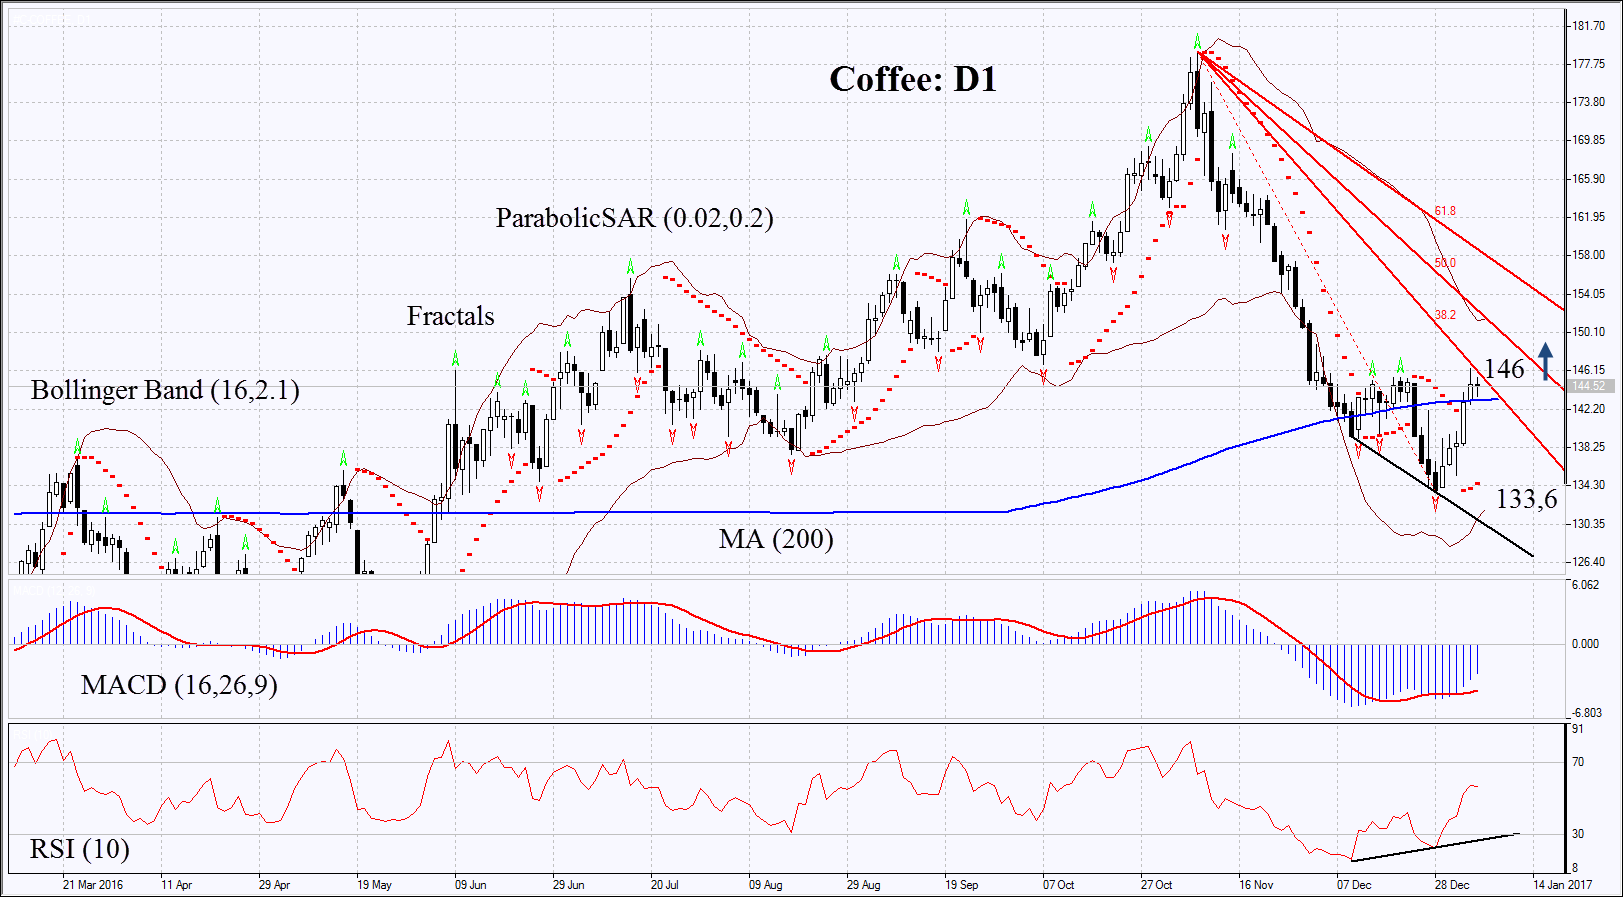
On the daily chart Coffee: D1 could not overcome the 7-month low and slightly corrected up. It remains in the medium-term downtrend. Accordingly, in order to open a buy position, the exchange rate should exceed its resistance level coinciding with the 1st line of Fibonacci Fan indicator. Further price increase is possible in case of keeping high demand for coffee and worse weather conditions in the main regions of its production - in South America and Southeast Asia.
-
Parabolic indicator gives a bullish signal.
-
Bollinger bands have widened which means higher volatility.
-
RSI indicator is above 50. It has formed positive divergence.
-
MACD indicator gives a bullish signal.
The bullish momentum may develop in case coffeeovercomes the 1st line of Fibonacci Fan indicator at 146. The initial stop-loss may be placed below the last fractal low, the Parabolic signal and the 7-month low at 133,6. The most risk-averse traders may use the 200-day moving average line as a stop-loss. After opening the pending order, we shall move the stop to the next fractal low following the Parabolic and Bollinger signals. Thus, we are changing the probable profit/loss ratio to the breakeven point. The most risk-averse traders may switch to the 4-hour chart after the trade and place there a stop-loss moving it in the direction of the trade. If the price meets the stop-loss level at 133,6 without reaching the order at 146, we recommend cancelling the position: the market sustains internal changes which were not taken into account.
Summary of technical analysis
|
Position |
Buy |
|
Buy stop |
Above 146 |
|
Stop loss |
Below 133,6 |
Want to get more free analytics? Open Demo Account now to get daily news and analytical materials.
Author

Dmitry Lukashov
IFC Markets
Dimtry Lukashov is the senior analyst of IFC Markets. He started his professional career in the financial market as a trader interested in stocks and obligations.


