Technical analysis: Will brent quotes grow?

| Indicator | Value | Signal |
| RSI | Buy | |
| MACD | Buy | |
| Parabolic SAR | Buy | |
| Fractals | Buy | |
| MA(200) | Neutral | |
| Bollinger Bands | Neutral |
Chart Analysis
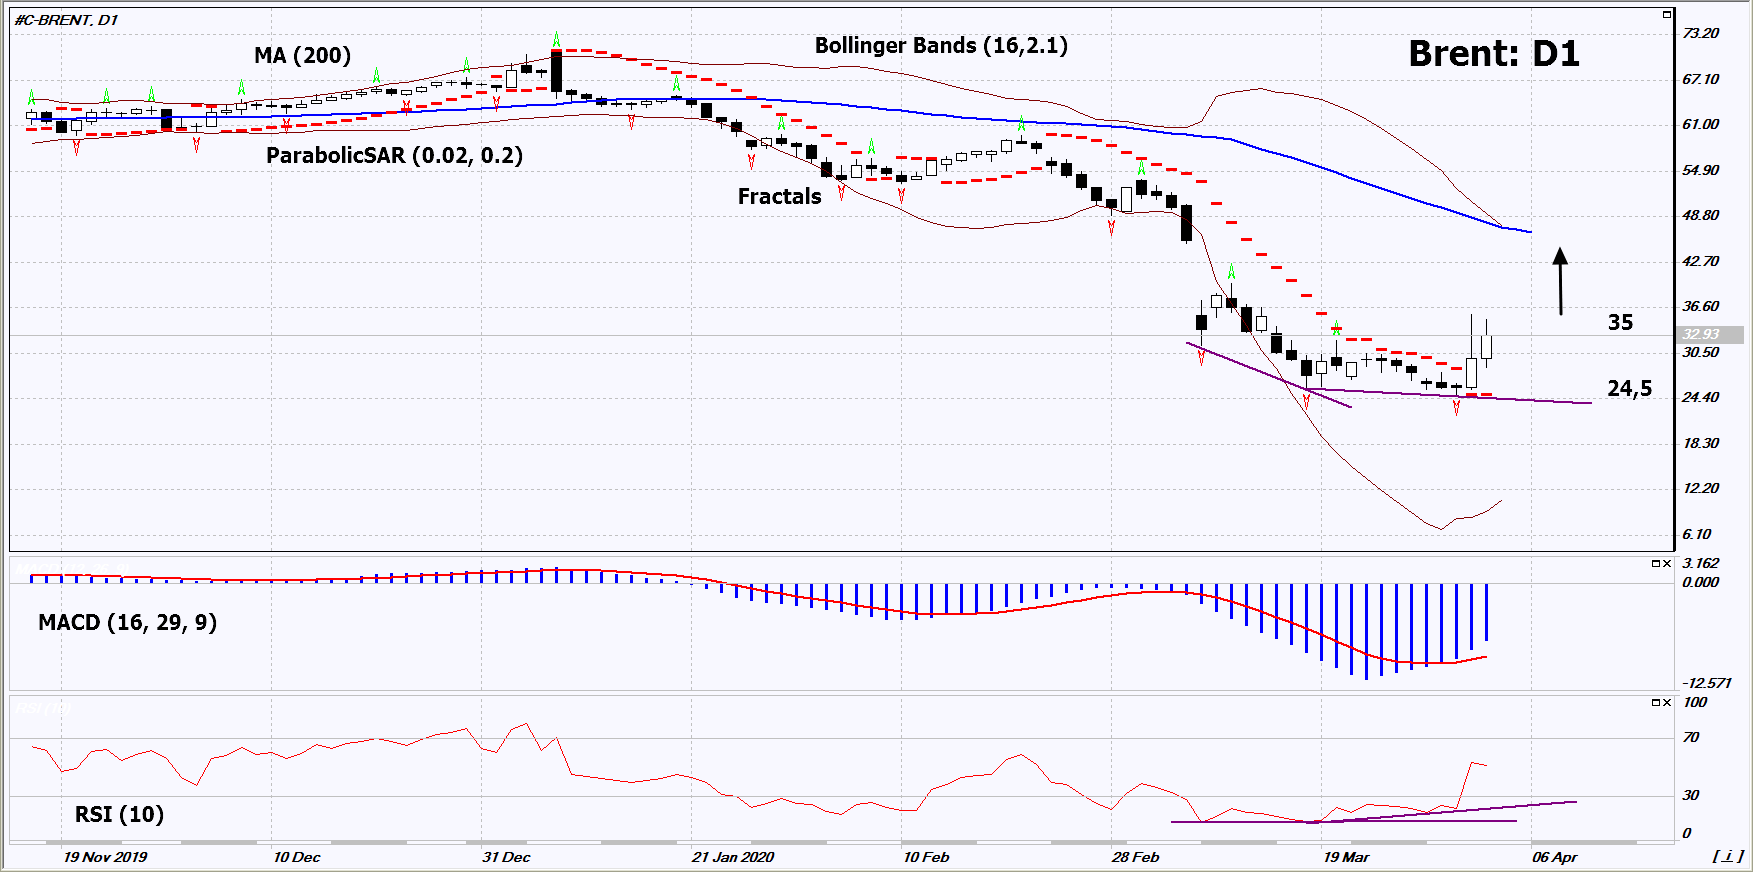
On the daily timeframe, Brent: D1 is trying to correct upward after a powerful decline. A number of indicators of technical analysis formed signals for a further increase. We do not rule out a bullish movement if Brent rises above its last maximum and psychological level: 35. This level can be used as an entry point. The stop loss is possible below the last lower fractal, the lower limit of the neutral range, the 18-year minimum and the Parabolic signal: 24.5. After opening the pending order, we move the stop loss following the signals of Bollinger and Parabolic to the next fractal minimum. Thus, we change the potential profit / loss ratio in our favor. After the transaction, the most risk-averse traders can switch to a four-hour chart and set a stop loss, moving it in the direction of trend. If the price overcomes the stop level (24.5) without activating the order (35), it is recommended to delete the order: market sustains internal changes not taken into account.
Fundamental Analysis
On April 6, 2020, an extraordinary OPEC + meeting is to be held to limit the oil production. Will Brent quotes grow?
Want to get more free analytics? Open Demo Account now to get daily news and analytical materials.
Want to get more free analytics? Open Demo Account now to get daily news and analytical materials.
Author

Dmitry Lukashov
IFC Markets
Dimtry Lukashov is the senior analyst of IFC Markets. He started his professional career in the financial market as a trader interested in stocks and obligations.


