Brent: the stop loss can be placed above last fractal high at 64.16

| Indicator | Value | Signal |
| RSI | 40.7661 | Neutral |
| Donchian Channel | Sell | |
| MACD | Buy | |
| MA(200) | 64.72 | Sell |
| Fractals | Sell | |
| Parabolic SAR | 64.55 | Sell |
Chart Analysis
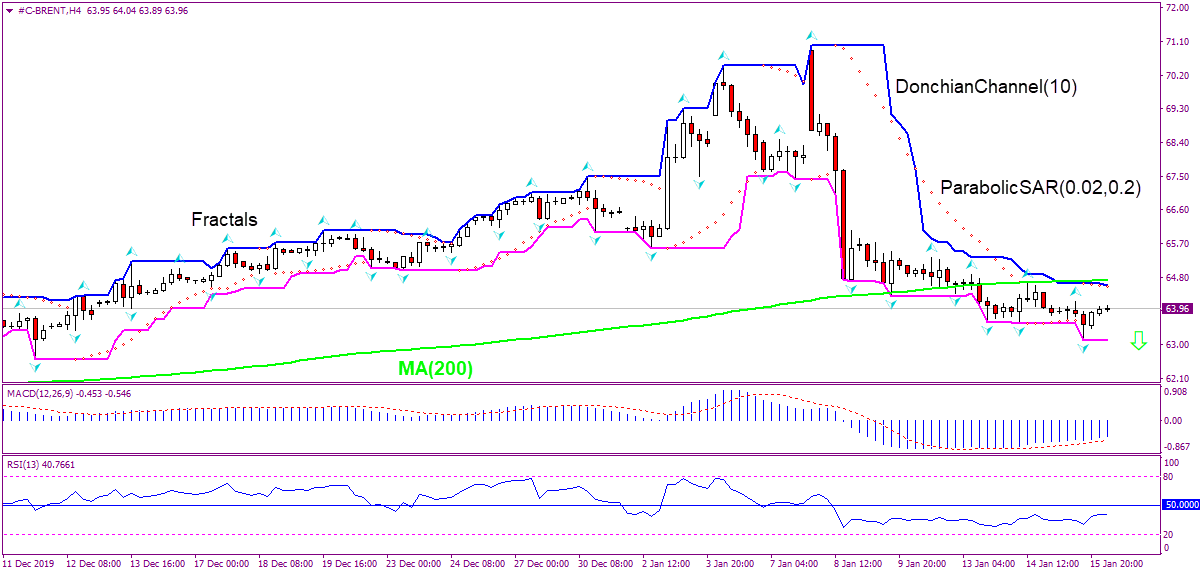
On the 4-hour timeframe the BRENT: H4 has fallen below the 200-period moving average MA(200) which is rising.
We believe the bearish momentum will resume after the price breaches below the lower boundary of Donchian channel at 63.12. A level below this can be used as an entry point for placing a pending order to sell. The stop loss can be placed above last fractal high at 64.16. After placing the order, the stop loss is to be moved every day to the next fractal high, following Parabolic signals. Thus, we are changing the expected profit/loss ratio to the breakeven point. If the price meets the stop loss level (64.16) without reaching the order ( 63.12), we recommend cancelling the order: the market has undergone internal changes which were not taken into account. Fundamental Analysis
EIA forecast global oil oversupply. Will the BRENT decline?
In a monthly report released Tuesday, the Energy Information Administration forecast an oversupply of petroleum relative to consumption. EIA estimates total global production of petroleum and other liquids at 102.37 million barrels a day, and total global consumption at 102.11 million barrels a day. Analysts therefore predict output surplus over the first half of this year. Higher global supply estimates are bearish for Brent. However official US data showed on Wednesday a drop in crude oil inventories last week when a build up was forecast by the American Petroleum Institute and S&P Global Platts. EIA reported US oil inventories fell by 2.5 million barrels, compared with S&P Global Platts analyst expectations of a drop of 500,000 barrels. An additional upside risk for oil prices is possible heightening of Middle East tensions.
Want to get more free analytics? Open Demo Account now to get daily news and analytical materials.
Want to get more free analytics? Open Demo Account now to get daily news and analytical materials.
Author

Dmitry Lukashov
IFC Markets
Dimtry Lukashov is the senior analyst of IFC Markets. He started his professional career in the financial market as a trader interested in stocks and obligations.


