Technical Analysis AUDUSD : 2018-09-20

Improving Australian data bullish for AUDUSD
August leading economic indicator ticked up in Australia while US inflation and retail sales reports were weaker than expected. Will the AUDUSD recovery continue?
The Westpac-Melbourne Institute Leading Economic Index in Australia rose by 0.1% over month in August after a flat reading in July. This signals accelerating growth of Australian economy as low level of interest rates is continuing to support the Australian economy after the Reserve Bank of Australia left the interest rate at 1.5% and signaled a steady policy ahead at its September 4 meeting. US economic data recently were mostly weaker than expected while indicating healthy US economic growth. The core inflation rate declined to 2.2% in August when a steady increase of 2.4% was expected. Positive Australian data while American indicators were weaker than expected is bullish for AUDUSD .
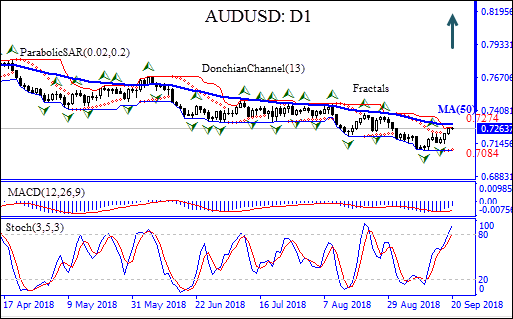
On the daily timeframe AUDUSD: D1 had been trading with negative bias after hitting thirty-nine-month high in the end of January. The price had fallen below the 50-day moving average MA(500) but is about to test it now.
-
The Parabolic indicator has formed a buy signal.
-
The Donchian channel indicates no trend yet: it is flat.
-
The MACD indicator is below the signal line with the gap narrowing. This is a bullish signal.
-
The stochastic oscillator is in the overbought zone, this is a bearish signal.
We believe the bullish momentum will continue after the price breaches above the upper Donchian boundary at 0.7274. This level can be used as an entry point for placing a pending order to buy. The stop loss can be placed below the lower Donchian channel at 0.7084. After placing the pending order the stop loss is to be moved every day to the next fractal low, following Parabolic signals. Thus, we are changing the probable profit/loss ratio to the breakeven point. If the price meets the stop-loss level (0.7084) without reaching the order (0.7274) we recommend cancelling the order: the market sustains internal changes which were not taken into account.
Technical Analysis Summary
|
Position |
Buy |
|
Buy Stop |
Above 0.7274 |
|
Stop loss |
Below 0.7084 |
Want to get more free analytics? Open Demo Account now to get daily news and analytical materials.
Want to get more free analytics? Open Demo Account now to get daily news and analytical materials.
Author

Dmitry Lukashov
IFC Markets
Dimtry Lukashov is the senior analyst of IFC Markets. He started his professional career in the financial market as a trader interested in stocks and obligations.


