Technical Analysis AUD/CHF: 2019-04-17
China’s statistics may also affect the Australian dollar
In this review, we would like to draw your attention to the Australian dollar vs. the Swiss franc currency pair. Will the AUDCHF continue to rise? Such dynamics is observed in case of the strengthening of the Australian dollar and the weakening of the Swiss franc.
The rate of the Swiss National Bank (SNB) is negative - minus 0.75%. Meanwhile, inflation in March of the current year rose to plus 0.7% compared with + 0.6%. Inflation in Switzerland has been positive since the beginning of 2017. An additional negative factor for the franc was the decrease in the manufacturing PMI for March to 50.3 points, which is the low since December 2015. Despite the risks of a slowdown in the economy, the head of the Swiss National Bank Thomas Jordan said at the end of the last week that there was no need to tighten the monetary policy. In turn, the rate of the Reserve Bank of Australia (RBA) is positive and is equal to 1.5% with + 1.8% inflation. Macroeconomic statistics of China, which is the main trading partner, may be a positive factor for the Australian dollar. Data on Chinese GDP for the 1st quarter of the current year, as well as retail sales and industrial production for March will come out on Thursday. If they turn out to be positive, then this may support the Australian dollar. It may also be affected by data on the Australian labor market, which will be published on Thursday, April 18. In case of an increase in unemployment, the RBA threatens to lower the rate.
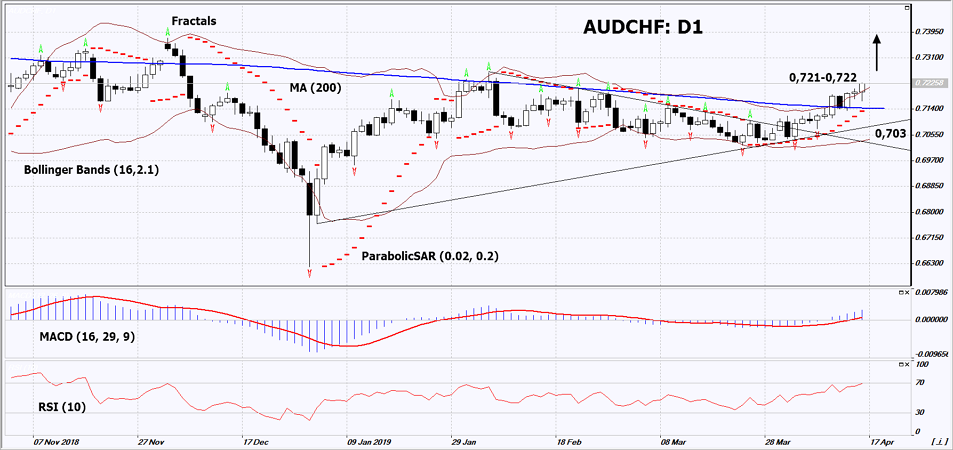
On the daily timeframe, AUDCHF: D1 has left the downtrend and moved upward. A number of technical analysis indicators formed buy signals. The further price increase is possible in case of the publication of positive data in Australia and negative data in Switzerland.
-
The Parabolic Indicator gives a bullish signal.
-
The Bollinger bands have started to widen, which indicates low volatility. Both Bollinger bands are titled upward.
-
The RSI indicator is above 50. No divergence.
-
The MACD indicator gives a bullish signal.
The bullish momentum may develop in case AUDCHF exceeds its last high at 0.721-0.722 This level may serve as an entry point. The initial stop loss may be placed below the two last fractal lows, the Parabolic signal and the lower Bollinger band at 0.703. After opening the pending order, we shall move the stop to the next fractal low following the Bollinger and Parabolic signals. Thus, we are changing the potential profit/loss to the breakeven point. More risk-averse traders may switch to the 4-hour chart after the trade and place there a stop loss moving it in the direction of the trade. If the price meets the stop level (0.703) without reaching the order (0.721-0.722), we recommend to close the position: the market sustains internal changes that were not taken into account.
Summary of technical analysis
|
Position |
Buy |
|
Buy stop |
Above 0.721-0.722 |
|
Stop loss |
Below 0.703 |
Want to get more free analytics? Open Demo Account now to get daily news and analytical materials.
Want to get more free analytics? Open Demo Account now to get daily news and analytical materials.
Author

Dmitry Lukashov
IFC Markets
Dimtry Lukashov is the senior analyst of IFC Markets. He started his professional career in the financial market as a trader interested in stocks and obligations.


