Technical analysis: Will the AU200 increase continue?
Recommendation for ASX 200 Index: Buy
Buy Stop: Above 7124.42.
Stop Loss: Below 6997.90.
RSI: Neutral
MACD: Sell
Donchian Channel : Neutral
MA(200): Buy
Fractals: Buy
Parabolic SAR: Buy
Chart analysis
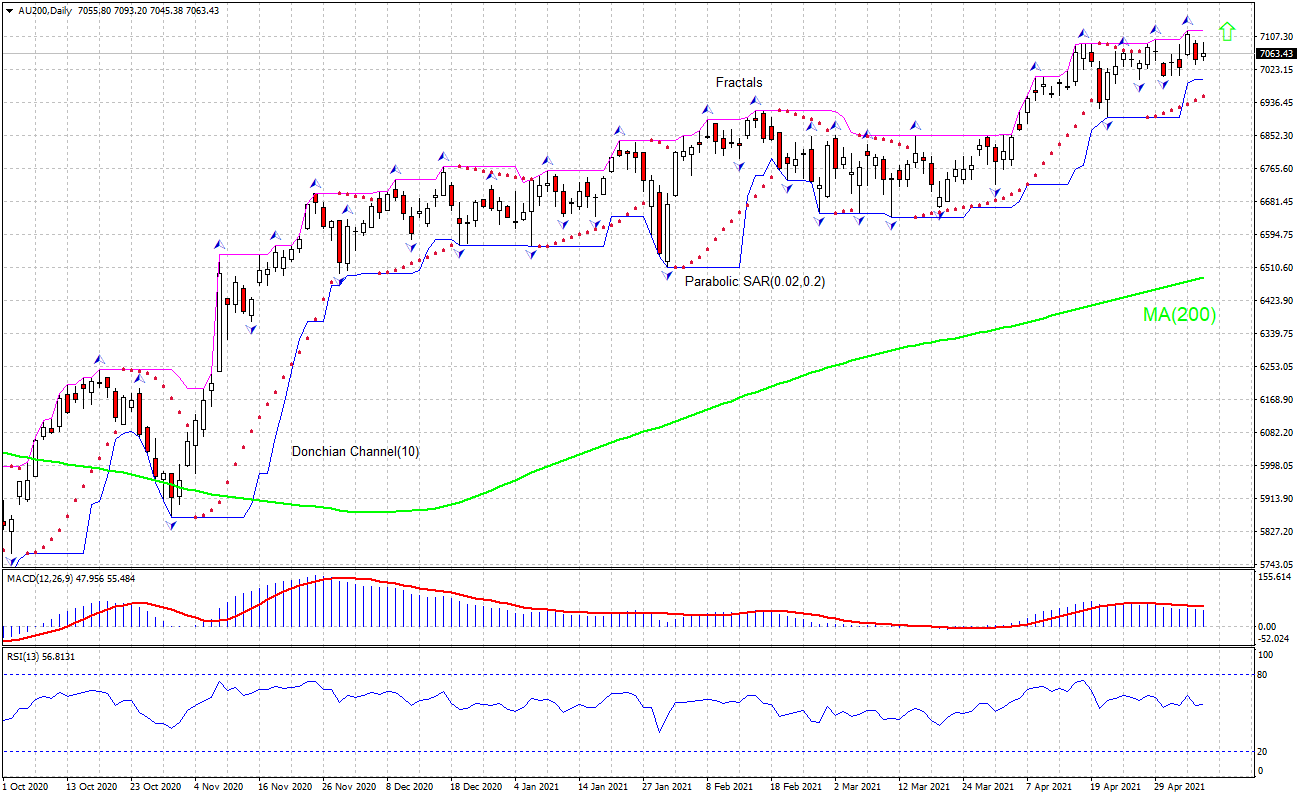
The AU200 technical analysis of the price chart on daily timeframe shows AU200: D1 is rebounding after pullback following a record close couple of sessions back. It has rallied above the 200-day moving average MA(200) which is rising. We believe the bullish momentum will continue after the price breaches above the upper Donchian boundary at 7124.42. This level can be used as an entry point for placing a pending order to buy. The stop loss can be placed below 6997.90. After placing the pending order the stop loss is to be moved every day to the next fractal low, following Parabolic signals. Thus, we are changing the expected profit/loss ratio to the breakeven point. If the price meets the stop-loss level (6997.90) without reaching the order (7124.42) we recommend cancelling the order: the market sustains internal changes which were not taken into account.
Fundamental analysis
Australia’s private sector activity expansion continued in April. Will the AU200 increase continue? Australia’s economic data in the last week were positive on balance: private sector expansion continued in April, as did the construction activity while building permits rose more than expected in March. Thus, the Markit Australia Composite PMI increased to 58.9 in April from 55.5 in the previous month and compared to a preliminary estimate of 58.8. Drivers of growth were the sustained increase in manufacturing output and a record rise in services activity. The Australian Industry Group reported the Australian Construction Index declined to 59.1 in April from 61.8 a month ago. Readings above 50 indicate sector expansion. And building permits rose 17.4% over month in March after 20.1% increase in February when a 3% increase was expected. Improving data are bullish for AU200.
Want to get more free analytics? Open Demo Account now to get daily news and analytical materials.
Want to get more free analytics? Open Demo Account now to get daily news and analytical materials.
Author

Dmitry Lukashov
IFC Markets
Dimtry Lukashov is the senior analyst of IFC Markets. He started his professional career in the financial market as a trader interested in stocks and obligations.


