TecDAX: German technology should continue show strength
TecDAX is a stock index which tracks the performance of 30 largest German companies from the technology sector. Even though these enterprises are of a high economic importance, their market capitalization and the book order turnover are far below of that of the DAX index. The TecDAX is related to DAX in a similar way like NASDAQ is related to Dow Jones Industrial Average index.
From technical perspective, NASDAQ has been the strongest index in the US. As a matter of fact, it has provided high rewards for those traders who were buying the dips for more upside. One of the features of the market behavior is that weak indices remain weak and strong indices remain strong. The fact that NASDAQ has been outpacing other US indices makes it a good candidate to buy it again once the indices turn higher again. Similar strong uptrend can be also seen in a behavior of TecDAX. This index, therefore, allows entering the German technology sector by providing investors and traders with high returns and protecting them, at the same time, from the defaults originating from trading of single stocks.
In the initial article from September 2020, we were calling for an extension higher within the cycle from March 2020 lows to the new highs. We were right. Now, we have ended a 1st wave of the new cycle. Current pullback should provide an opportunity for an acceleration higher.
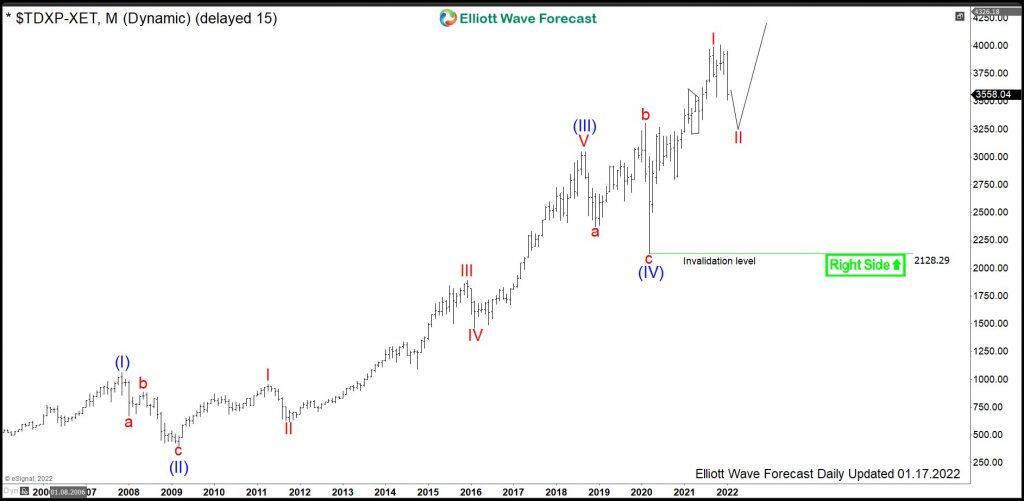
TecDAX monthly Elliott Wave analysis 01.17.2022
The monthly chart below shows the TecDAX index $TDXP listed at Frankfurt Stock Exchange. From the all-time lows, the index price has developed a cycle higher in wave (I) of a super cycle degree. It has ended in November 2007 at 1060.35. From there, a correction lower in wave (II) has retraced part of the rise by printing a bottom in March 2009 at 387.50.
In 2013, TecDAX was able to make a higher high opening up a bullish sequence. As a matter of fact, it has extended from March 2009 lows far beyond 1.618. Therefore, the cycle higher is an impulse in blue wave (III). It has reached 3051.44 highs in September 2018. From the top, a correction lower has unfolded as an expanded flat which has found its bottom in March 2020 at 2127.05.
From the March 2020 lows, we have broken to the new all-time highs confirming an extension in the blue wave (V). After a pullback, TecDAX should continue its rally.
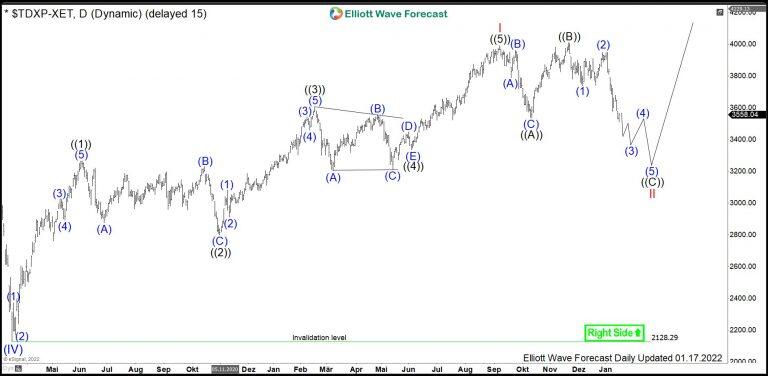
TecDAX daily Elliott Wave analysis 01.17.2022
The daily chart below shows in more detail the $TDXP price action from the March 2020 lows. The advance is an impulse in red wave I of blue wave (V) which has ended in September 2021 at 3990.76. From there, a pullback in wave II unfolds as an expanded flat structure. Hereby, wave ((A)) of II has ended in October 2021. Then, wave ((B)) of II has printed a new all-time high at 4010.04 in the following November. While below there, wave ((C)) is currently in progress. As of right now, the pattern looks incomplete. Once 5 waves of ((C)) of II will accomplish, then expect an acceleration higher in wave III of (V) to take place. The prices should then extend towards 4010.04 and beyond.
Author

Elliott Wave Forecast Team
ElliottWave-Forecast.com


