Tariffs Torpedoes Markets

Good Morning Traders,
As of this writing 4 AM EST, here’s what we see:
US Dollar: Sept. USD is Up at 94.625.
Energies: Jul '18 Crude is Down at 63.98.
Financials: The Sept 30 year bond is Up 11 ticks and trading at 144.00.
Indices: The Sept S&P 500 emini ES contract is 52 ticks Lower and trading at 2771.50.
Gold: The Aug gold contract is trading Up at 1282.50. Gold is 40 ticks Higher than its close.
Initial Conclusion
This is not a correlated market. The dollar is Up+ and Crude is Down- which is normal and the 30 year Bond is trading Higher. The Financials should always correlate with the US dollar such that if the dollar is lower then bonds should follow and vice-versa. The S&P is Lower and Crude is trading Lower which is not correlated. Gold is trading Up+ which is not correlated with the US dollar trading Up+. I tend to believe that Gold has an inverse relationship with the US Dollar as when the US Dollar is down, Gold tends to rise in value and vice-versa. Think of it as a seesaw, when one is up the other should be down. I point this out to you to make you aware that when we don't have a correlated market, it means something is wrong. As traders you need to be aware of this and proceed with your eyes wide open.
At this hour all of Asia is trading Lower and currently Europe is trading Lower as well.
Possible Challenges To Traders Today
NAHB Housing Market Index is out at 10 AM. This is major. FOMC Member Bostic Speaks at 1 PM EST. This is major.
Treasuries
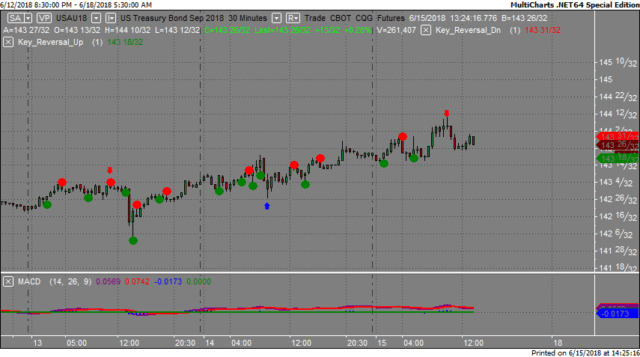
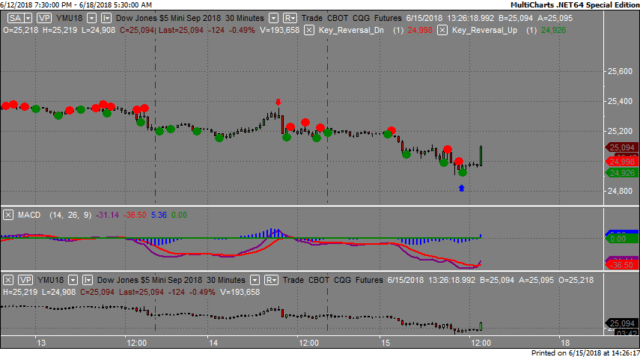
We've elected to switch gears a bit and show correlation between the 30 year bond (ZB) and The YM futures contract. The YM contract is the DJIA and the purpose is to show reverse correlation between the two instruments. Remember it's liken to a seesaw, when up goes up the other should go down and vice versa.
On Friday the ZB made it's move at around 10 AM EST. The ZB hit a High at around that time and the YM hit a Low. If you look at the charts below ZB gave a signal at around 10 AM EST and the YM was moving Higher at the same time. Look at the charts below and you'll see a pattern for both assets. ZB hit a High at around 10 AM and the YM was moving Higher at the same time. These charts represent the newest version of MultiCharts and I've changed the timeframe to a 30 minute chart to display better. This represented a shorting opportunity on the 30 year bond, as a trader you could have netted about 15 ticks per contract on this trade. Each tick is worth $31.25.
Charts Courtesy of MultiCharts built on an AMP platform
Bias
On Friday we gave the markets a Downside bias as the USD and Bonds trading Higher Friday morning and this usually reflects a Downside day. The Dow dropped 85 points and the other indices lost ground as well. Today we aren't dealing with a correlated market and our bias is to the Downside.
Could this change? Of Course. Remember anything can happen in a volatile market.
Commentary
As predicted the Dow dropped based on our rules of Market Correlation. On Thursday evening it was announced that President Trump had agreed to impose tariffs on 50 billion dollars worth of Chinese imports. By Friday the markets didn't take too kindly to this news and the Dow dropped by as much as 200 points on Friday. It's generally not a good idea to talk free trade and not practice it. Today we have the NAHB Housing market index which is major and a proven market mover so time will tell if this resonates well with the markets...
Author

Nick Mastrandrea
Market Tea Leaves


