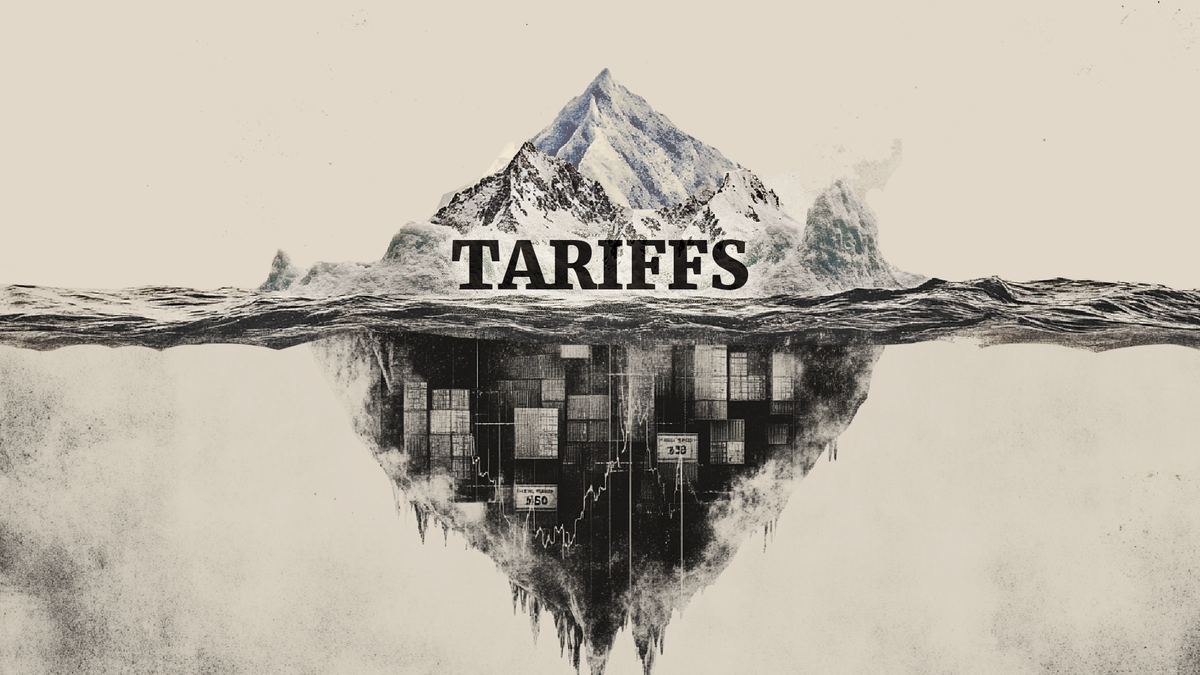
Tariffs on again?
USD: Jun '25 is Down at 98.750.
Energies: Jul '25 Crude is Up at 63.28.
Financials: The Sep '25 30 Year T-Bond is Lower by 11 ticks and trading at 112.14.
Indices: The Jun '25 S&P 500 emini ES contract is 106 ticks Lower and trading at 5889.50.
Gold: The Aug'25 Gold contract is trading Up at 3371.10.
Initial conclusion
This is not a correlated market. The USD is Down and Crude is Up which is normal, and the 30 Year T-Bond is trading Lower. The Financials should always correlate with the US dollar such that if the dollar is Higher, then the bonds should follow and vice-versa. The S&P is Lower and Crude is trading Higher which is correlated. Gold is trading Higher which is correlated with the US dollar trading Down. I tend to believe that Gold has an inverse relationship with the US Dollar as when the US Dollar is down, Gold tends to rise in value and vice-versa. Think of it as a seesaw, when one is up the other should be down. I point this out to you to make you aware that when we don't have a correlated market, it means something is wrong. As traders you need to be aware of this and proceed with your eyes wide open. All of Asia traded Lower. All of Europe is trading Lower as well.
Possible challenges to traders
-
Final Manufacturing PMI is out at 9:45 AM EST. This is Major.
-
ISM Manufacturing PMI is out at 10 AM EST. This is Major.
-
ISM Manufacturing Prices is out at 10 AM EST. This is Major.
-
Construction Spending m/m is out at 10 AM EST. This is Major.
-
FOMC Member Logan Speaks at 10:15 AM EST. This is Major.
-
FOMC Member Goolsbee Speaks at 12:45 PM EST. This is Major.
-
Fed Chair Powell Speaks at 1 PM EST. This is Major.
Traders, please note that we've changed the Bond instrument from the 10 Year (ZN) to the 2 Year (ZT). They work exactly the same.
We've elected to switch gears a bit and show correlation between the 2-year Treasury notes (ZT) and the S&P futures contract. The YM contract is the Dow Jones Industrial Average, and the purpose is to show reverse correlation between the two instruments. Remember it's likened to a seesaw, when up goes up the other should go down and vice versa.
On Friday the ZT climbed Higher at around 7:30 AM EST with no real news to speak of. The Dow dived Lower at the same time. Look at the charts below and you'll see a pattern for both assets. The Dow moved Lower at 7:30 AM EST and the ZT climbed Higher at around the same time. These charts represent the newest version of Bar Charts, and I've changed the timeframe to a 15-minute chart to display better. This represented a Long opportunity on the 2-year note, as a trader you could have netted about 20 plus ticks per contract on this trade. Each tick is worth $6.25. Please note: the front month for ZT is now Sep '25 and the Dow is still Jun '25. I've changed the format to filled Candlesticks (not hollow) such that it may be more apparent and visible.
Charts courtesy of BarCharts
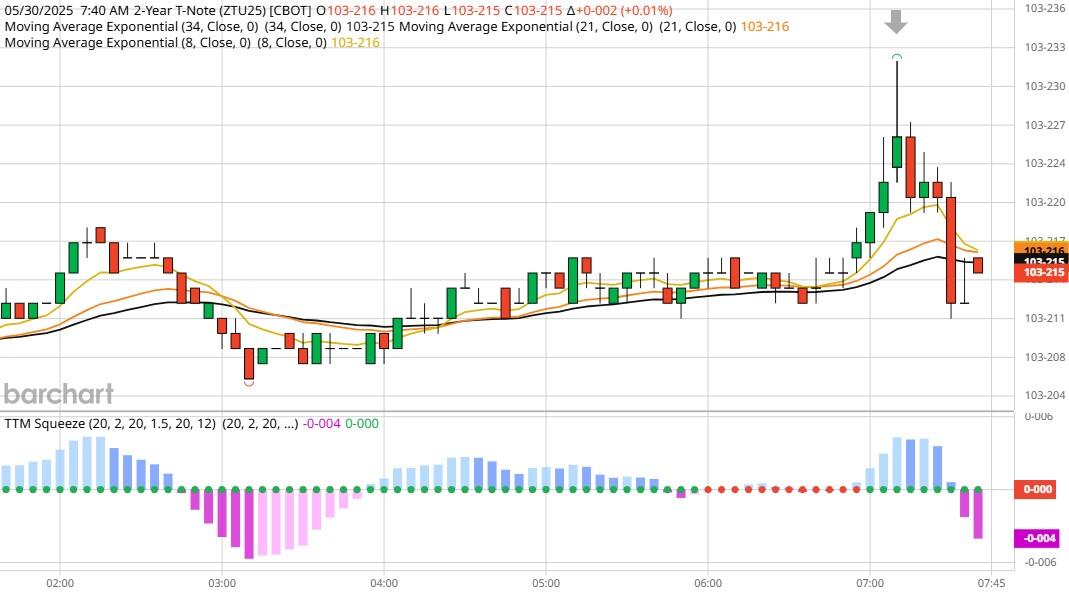
ZT -Sep 2025 - 5/30/25
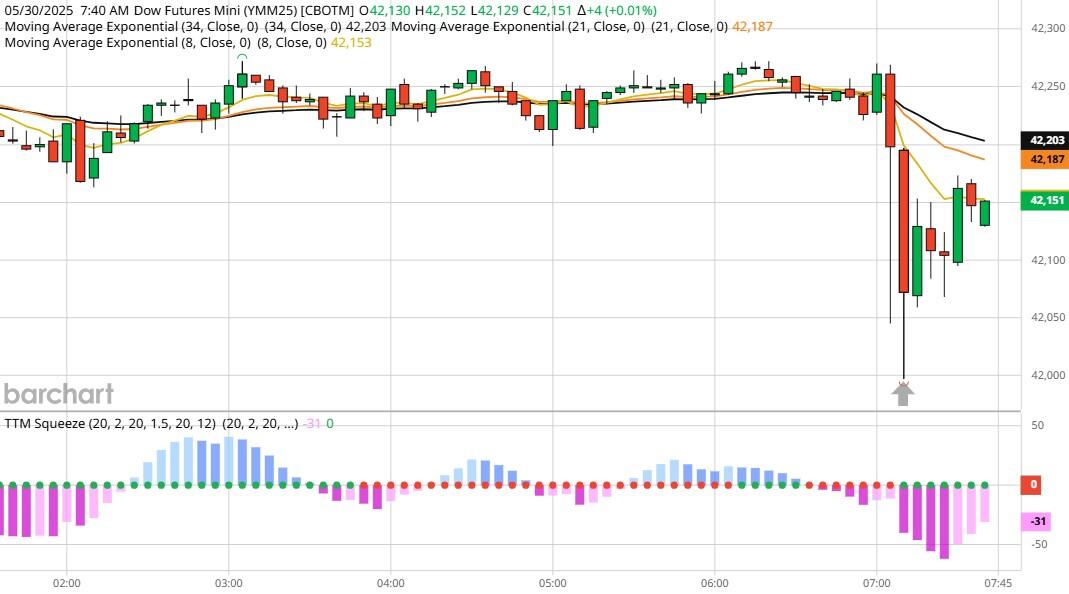
Dow - Jun 2025- 5/30/25
Bias
On Friday we gave the markets a Neutral or Mixed bias and the markets didn't disappoint. The Dow gained 54 points on the session, but the other indices traded Lower. Today we are dealing with a nearly correlated market, and our bias is to the Downside.
Could this change? Of Course. Remember anything can happen in a volatile market.
Commentary
On Friday we learned that the Trump trade tariffs were back on as a court agreed to lift the ban. Apparently, the markets don't like the idea of Higher prices which the tariffs will create. Want to learn Market Correlation and determine market direction hours before the Opening Bell?
Author

Nick Mastrandrea
Market Tea Leaves


