Tariff talk takes toll

USD: Mar '25 is Down at 105.900.
Energies: Apr '25 Crude is Down at 67.14.
Financials: The Jun '25 30 Year T-Bond is Higher by 10 ticks and trading at 119.04.
Indices: The Mar '25 S&P 500 emini ES contract is 120 ticks Lower and trading at 5830.00.
Gold: The Feb'25 Gold contract is trading Up at 2932.60.
Initial conclusion
This is not a correlated market. The USD is Down and Crude is Down which is not normal, and the 30 Year T-Bond is trading Lower. The Financials should always correlate with the US dollar such that if the dollar is Higher, then the bonds should follow and vice-versa. The S&P is Lower and Crude is trading Lower which is not correlated. Gold is trading Higher which is correlated with the US dollar trading Down. I tend to believe that Gold has an inverse relationship with the US Dollar as when the US Dollar is down, Gold tends to rise in value and vice-versa. Think of it as a seesaw, when one is up the other should be down. I point this out to you to make you aware that when we don't have a correlated market, it means something is wrong. As traders you need to be aware of this and proceed with your eyes wide open. All of Asia traded Higher except the Shanghai and Sensex exchanges. All of Europe is trading Higher.
Possible challenges to traders
-
RCM/TIPP Economic Optimism - tentative. This is Major.
-
FOMC Member Williams Speaks at 2:20 PM EST. This is Major.
-
No Major economic news to speak of.
Traders, please note that we've changed the Bond instrument from the 10 year (ZN) to the 2 year (ZT). They work exactly the same.
We've elected to switch gears a bit and show correlation between the 2-year Treasury notes (ZT) and the S&P futures contract. The YM contract is the Dow Jones Industrial Average, and the purpose is to show reverse correlation between the two instruments. Remember it's likened to a seesaw, when up goes up the other should go down and vice versa.
Yesterday the ZT Migrated Higher at around 8:15 AM EST with no economic news reported. The Dow moved Lower at the same time. Look at the charts below and you'll see a pattern for both assets. The Dow moved Lower at 8:15 AM EST and the ZT moved Higher at around the same time. These charts represent the newest version of Bar Charts, and I've changed the timeframe to a 15-minute chart to display better. This represented a Long opportunity on the 2-year note, as a trader you could have netted about a dozen ticks per contract on this trade. Each tick is worth $7.625. Please note: the front month for ZT is now Jun '25 and the Dow is still Mar '25. I've changed the format to filled Candlesticks (not hollow) such that it may be more apparent and visible.
Charts courtesy of barcharts
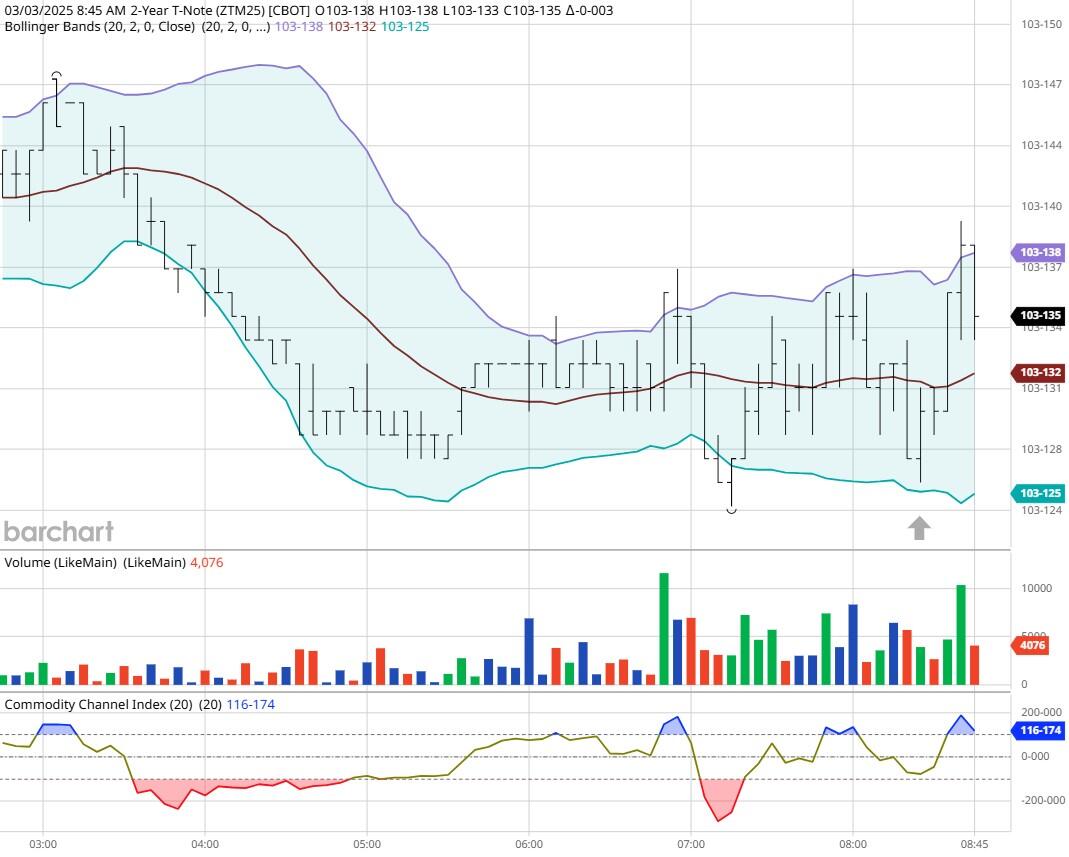
ZT -Jun 2025 - 3/03/25
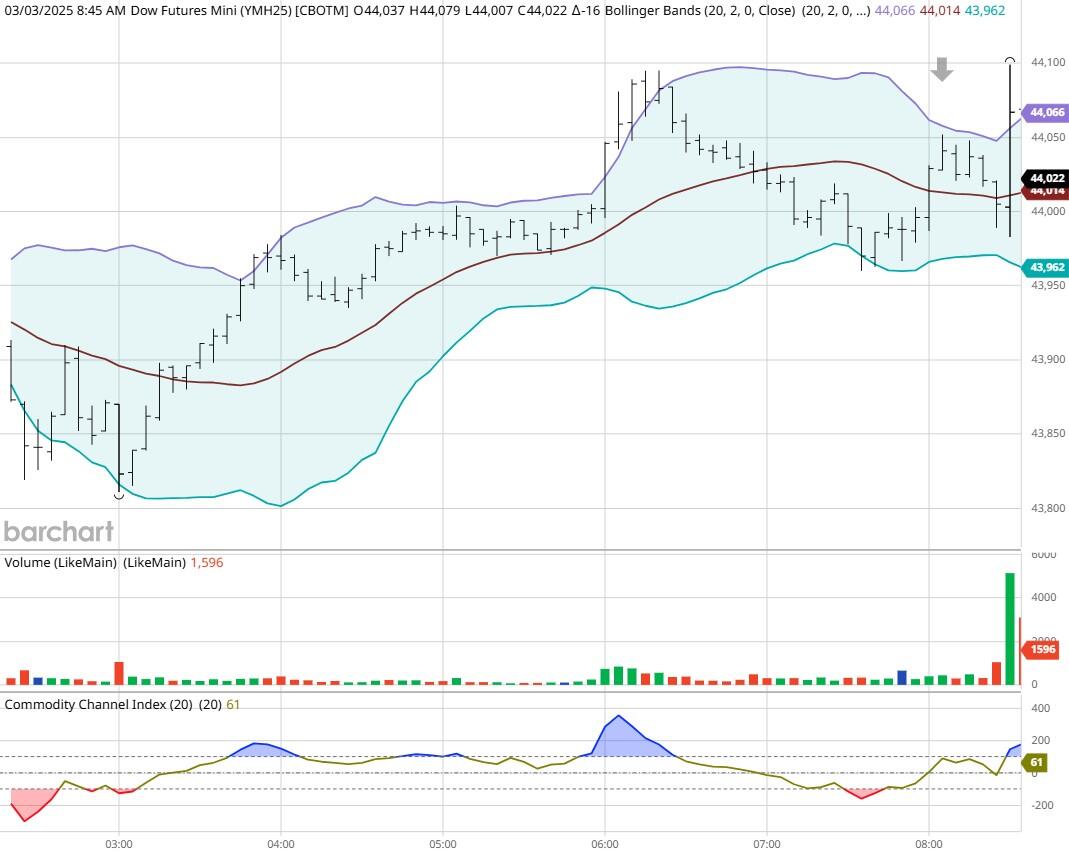
Dow - Mar 2025- 3/03/25
Bias
Yesterday we gave the markets an Upside bias as the markets were correlated in that direction. The markets had other plans as the Dow dropped 650 points, and the other indices lost ground as well. Today we aren't dealing with a correlated market, and our bias is Neutral or Mixed.
Could this change? Of Course. Remember anything can happen in a volatile market.
Commentary
Ever since this president has taken office, we haven't seen a good correlated market, and I believe that's because of the continued talks on tariffs. Yesterday it was announced that the tariffs for Mexico and Canada will commence on April 2nd, so that's a go. In fact, some of it will start today and the indices are reflecting that now. The markets did not take this news very well and at its peak the Dow dropped over 800 points.
Author

Nick Mastrandrea
Market Tea Leaves


