Sweat, Blood and Tears

Trading position (short-term; our opinion): No positions are justified from the risk/reward perspective.
On Tuesday, crude oil hit a fresh 2018 high of $64.89, but then reversed and declined very quickly, erasing most of Friday increase. What encouraged oil bears to act and how did this decline affect the short-term picture?
Yesterday, the Energy Information Administration said that U.S. oil output is expected to continue its rise to 6.55 million barrels per day (with production from shale rising by 111,000 bpd) in the coming month, which encouraged oil bears to act. As a reminder, before the Friday market closure, they received one more reason to act – the Baker Hughes report, which showed that the oil rig count jumped by 10 to 752 (to the highest level since the beginning of September 2017). What impact did the above-mentioned circumstances have on the daily chart of crude oil?
Technical Picture of Crude Oil
Let’s start today’s alert with the long-term chart of black gold.
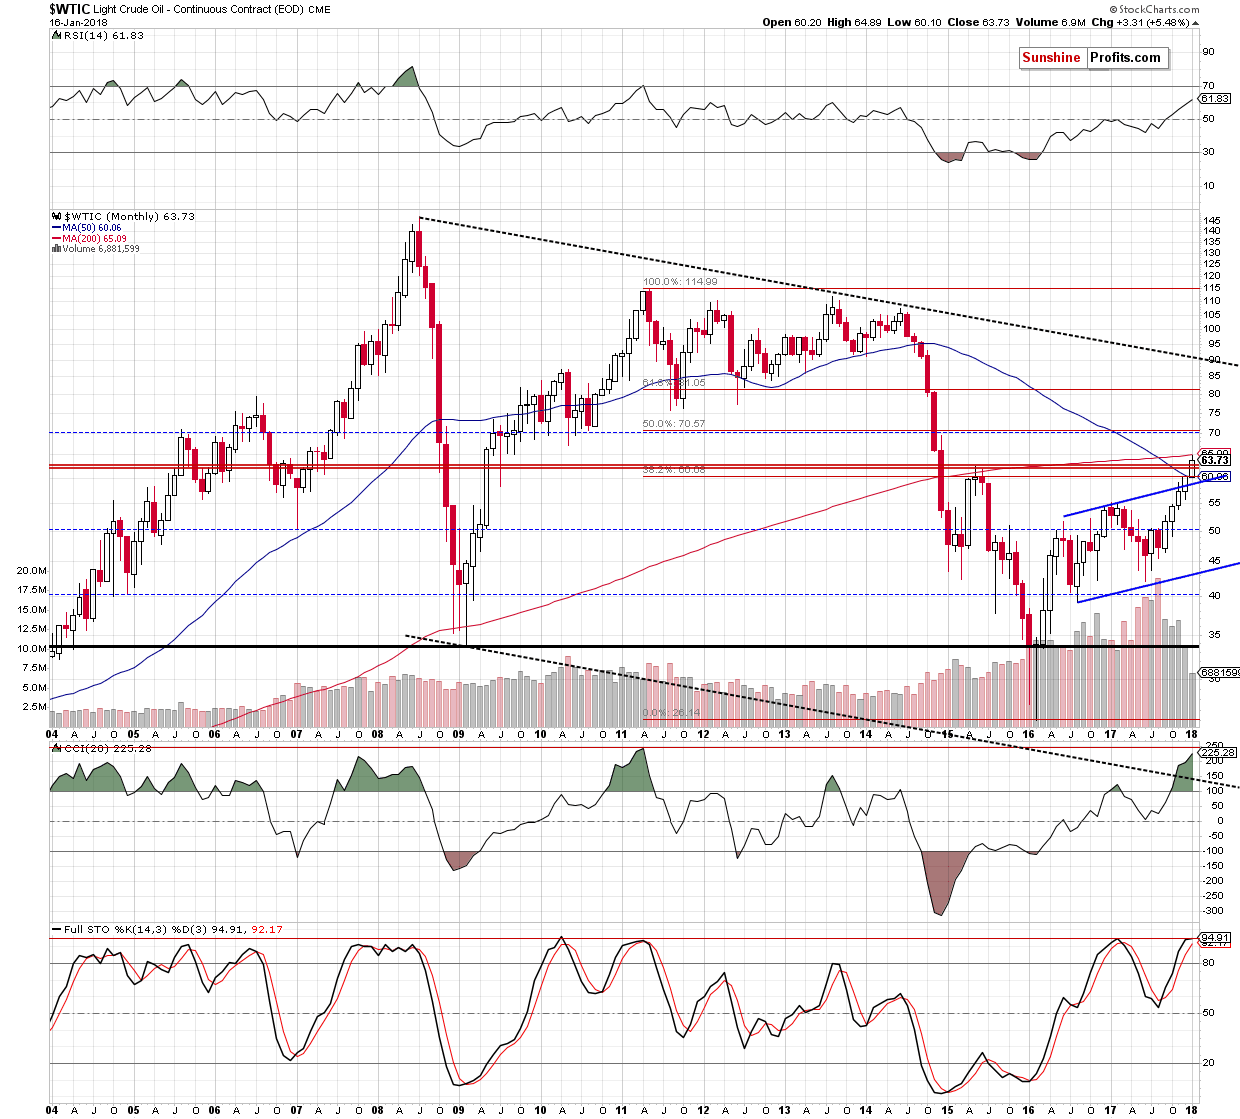
From the long-term perspective, we clearly see that the situation didn’t change much. Why? Because black gold is still trading under the 200-month moving average, whichsuccessfully continues to block the way to higher prices.
Did Tuesday fresh high change anything in the shorter perspective?
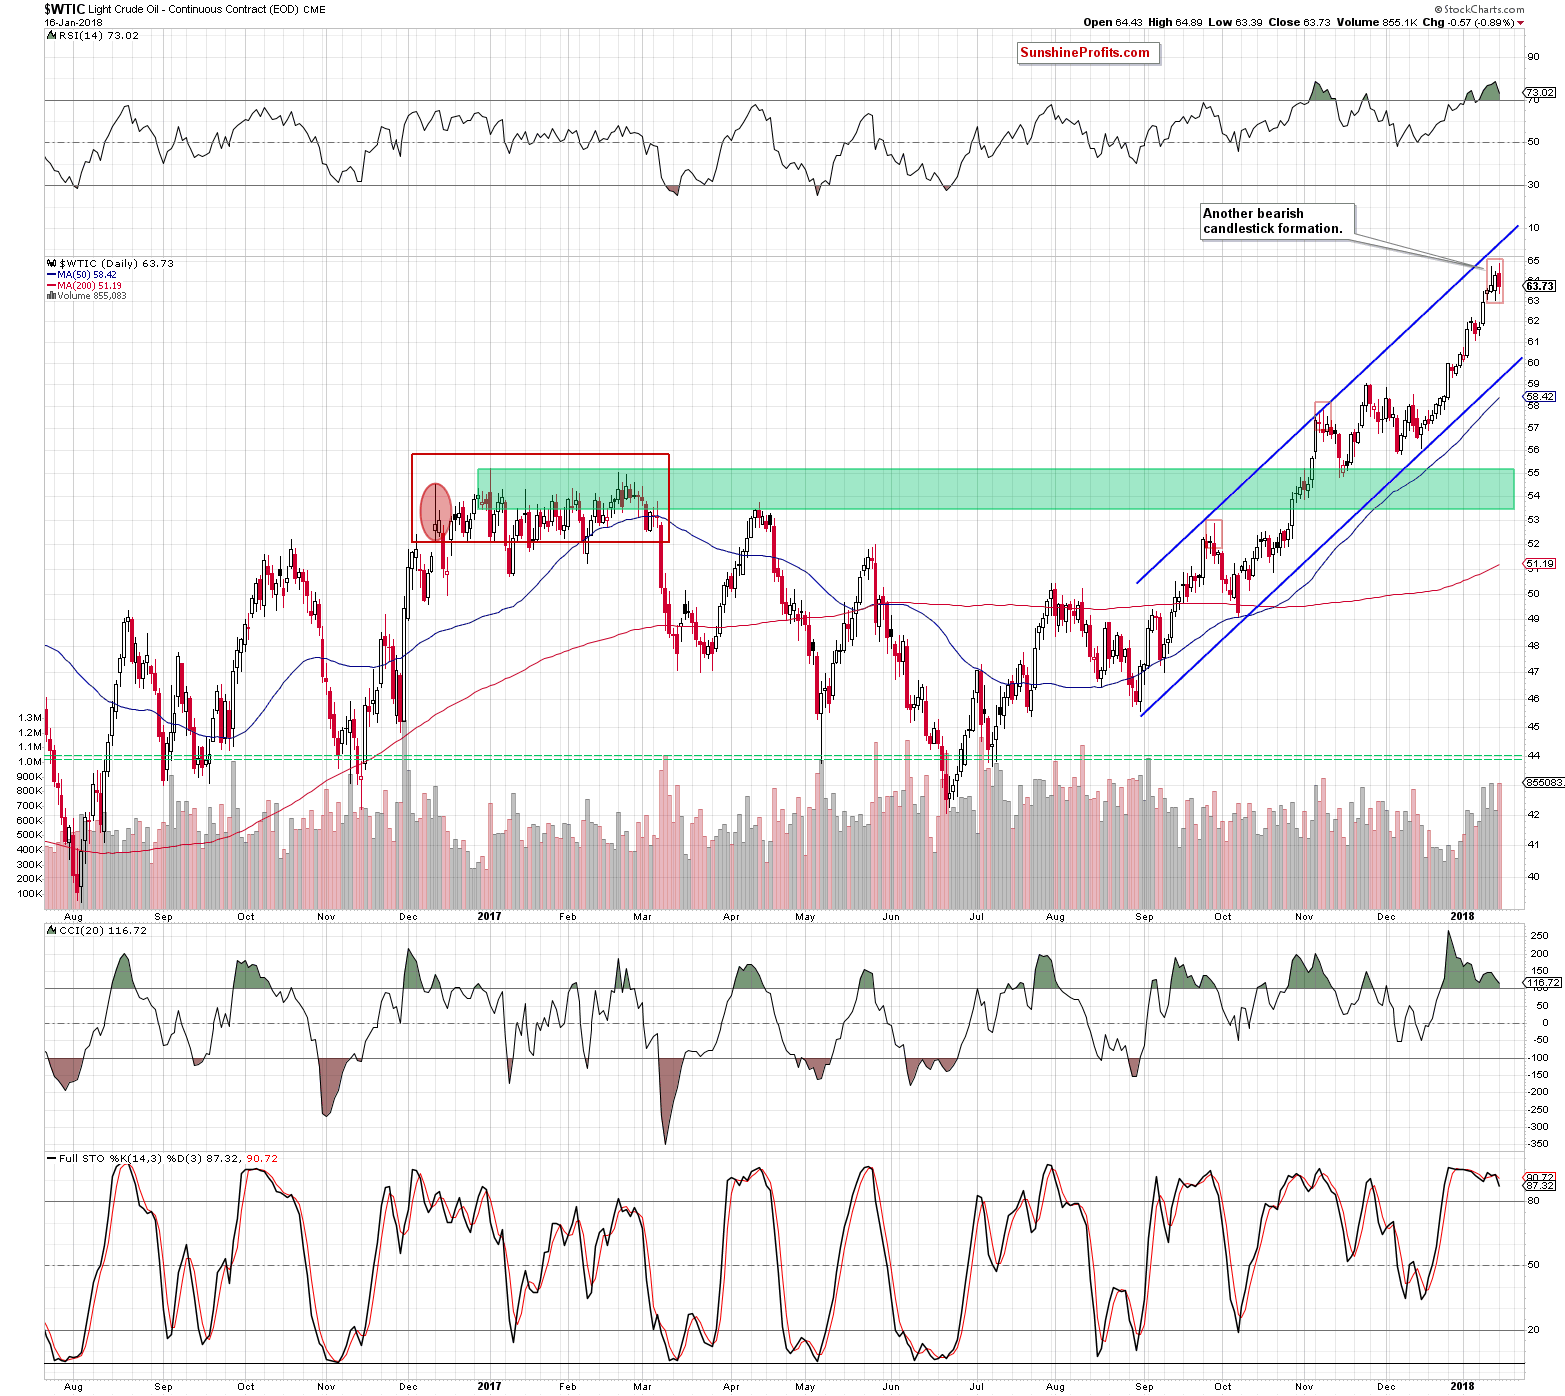
In our yesterday's alert we wrote that although oil bulls did their best, the pro bearish candlestick formation remains in the cards (more about its parameters and its overtones we wrote in our last Oil Trading Alert).
Additionally, volume, which accompanied Friday’s upswing was visibly lower than day earlier, which raises some doubts about the continuation of the rally (especially when we factor in the current position of the indicators). Nevertheless, we should keep in mind that crude oil futures hit a fresh 2018 high of $64.89 yesterday.
What does it mean for black gold? Taking into account the fact that the commodity usually follows futures’ price action, we think that one more upswing and a test of the above-mentioned 200-month moving average (currently at $65.09) can’t be ruled out.
From today’s point of view, we see that oil bulls pushed black oil higher as we had expected, but they didn’t even manage to test the 200-month moving average, which showed their weakness.
Additionally, although crude oil climbed to the highest level in 2018, yesterday peak was only 12 cents above the last week high. It’s hard to consider this event as a spectacular success - especially when we consider the fact that yesterday“increase” was corrected by oil bears very quickly.
What impact did it have on the technical picture of the commodity? Negative, because the sellers created another bearish candlestick formation on the daily chart - dark-cloud cover. What does it mean from a psychological point of view? Simply speaking, it illustrates a quite sudden change in mood among investors.
The first part of this formation is dominated by supporters of the current trend. We see a white candle (created on Friday) on the chart, which shows that the bulls don’t have problems with maintaining the direction (at lest at the first sight). The opening of the second candle continues to confirm the continuation of the trend and the price climbs to a fresh peak. However, what happens next causes chaos among investors who have long positions. Why? Because the price declines below half of the body of the white candle, which is usually treated as a specific barrier to correction. Therefore, when the price drops under this barrier investors are afraid of further losses and they are trying to close their positions, causing the market to deepen the downward move.
Please keep in mind that the effectiveness of this formation depends on many factors (it is considered as one of the weaker pro-bearish formations), however, when we take into account other technical details, the probability of reversal and bigger move to the downside increases.
What details do we mean? Firstly, the shooting star remains in the cards. Secondly, volume, which accompanied yesterday decline was significant, which suggests that oil bears can gathering to fight. Thirdly, the proximity to the 200-month moving average continues to support oil bears. Fourthly, there are clearly visible bearish divergences between all indicators and the price of crude oil. Fifthly, the Stochastic Oscillator generated the sell signal, while the RSI and the CCI are very close to doing the same.
Summing up, although crude oil hit a fresh 2018 high, the commodity reversed and declined, creating another bearish formation on the daily chart, which together with the current position of the indicators and the proximity to important resistance increases the probability of a bigger move to the south in the coming days.
Trading position (short-term; our opinion):we’reconsidering openingsmall short positions, but to increase the chance of a profitable positions we will wait for a confirmation of our assumptions.
If you enjoyed the above analysis and would like to receive free follow-ups, we encourage you to sign up for our daily newsletter – it’s free and if you don’t like it, you can unsubscribe with just 2 clicks. If you sign up today, you’ll also get 7 days of free access to our premium daily Oil Trading Alerts as well as Gold & Silver Trading Alerts.
Want free follow-ups to the above article and details not available to 99%+ investors? Sign up to our free newsletter today!
Author

Nadia Simmons
Sunshine Profits


