Super bowl weekend

USD: Mar '24 is Up at 104.070.
Energies: Mar '24 Crude is Down at 76.19.
Financials: The Mar '24 30 Year T-Bond is Up 5 ticks and trading at 119.27.
Indices: The Mar '24 S&P 500 emini ES contract is 30 ticks Higher and trading at 5025.50.
Gold: The Feb'24 Gold contract is trading Down at 2046.50.
Initial conclusion
This is not a correlated market. The USD is Up and Crude is Down which is normal, but the 30 Year T-Bond is trading Higher. The Financials should always correlate with the US dollar such that if the dollar is Higher, then the bonds should follow and vice-versa. The S&P is Higher and Crude is trading Lower which is correlated. Gold is trading Lower which is correlated with the US dollar trading Up. I tend to believe that Gold has an inverse relationship with the US Dollar as when the US Dollar is down, Gold tends to rise in value and vice-versa. Think of it as a seesaw, when one is up the other should be down. I point this out to you to make you aware that when we don't have a correlated market, it means something is wrong. As traders you need to be aware of this and proceed with your eyes wide open. Asia is trading Higher with the exception of the Hang Seng and Singapore exchanges. All of Europe is trading Higher with the exception of the Paris exchange.
Possible challenges to traders
-
No Major Economic News to speak of.
-
Lack of Major Economic News.
Treasuries
Traders, please note that we've changed the Bond instrument from the 30 year (ZB) to the 10 year (ZN). They work exactly the same.
We've elected to switch gears a bit and show correlation between the 10-year bond (ZN) and the S&P futures contract. The S&P contract is the Standard and Poor's, and the purpose is to show reverse correlation between the two instruments. Remember it's likened to a seesaw, when up goes up the other should go down and vice versa.
Yesterday the ZN migrated Lower at around 1 PM EST as the S&P hit a Low at around the same time. If you look at the charts below the S&P gave a signal at around 1 PM and the ZN started its Downward trend. Look at the charts below and you'll see a pattern for both assets. S&P hit a Low at around 1 PM and migrated Higher. These charts represent the newest version of MultiCharts and I've changed the timeframe to a 15-minute chart to display better. This represented a Short opportunity on the 10-year note, as a trader you could have netted about 20 ticks per contract on this trade. Each tick is worth $15.625. Please note: the front month for the ZN is now Mar '24. The S&P contract is now Mar' 24. I've changed the format to filled Candlesticks (not hollow) such that it may be more apparent and visible.
Charts courtesy of MultiCharts built on an AMP platform
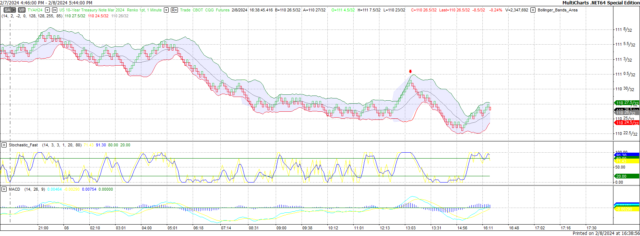
ZN - Mar 2024 - 02/08/24
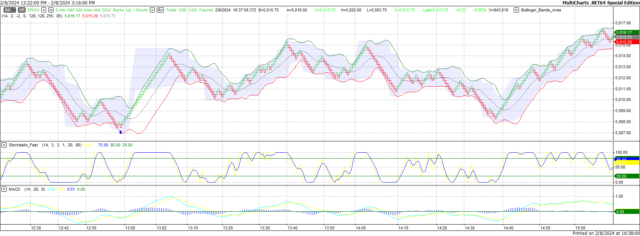
S&P - Mar 2024 - 02/08/24
Bias
Yesterday we gave the markets a Downside bias as both the USD and Crude were trading Higher Thursday morning and tis usually reflects a Downside Day. Up until approximately 2:30 PM the markets were trading Lower but then switched to the Long side and closed Higher. The Dow gained 49 points and the other indices migrated fractionally Higher. Today we aren't dealing with a correlated market and our bias is Neutral or Mixed.
Could this change? Of Course. Remember anything can happen in a volatile market.
Commentary
Yesterday when we first viewed the markets, we saw the strong possibility of a Downside Day as both the USD and Crude were trading Higher and that usually reflects a Lower market. Up until 2:30 PM the markets were trading Lower then migrated to the Upside but not by much. On another note, this weekend marks Super Bowl 58 and I still remember Super Bowl 1 in 1967, although it wasn't called a Super Bowl until Super Bowl 3 in 1969 when Joe Namath made his famous announcement. The first couple of games was called the AFL-NFL World Championship Game. Back then there was an AFL (American Football League). The two leagues merged in 1970. So this weekend is a time to kick back, relax and enjoy the show, hang with friends and family and just enjoy. We'll have plenty to talk about after the game.
Author

Nick Mastrandrea
Market Tea Leaves


