Stocks Lower Again as Plot Thickens in Earnings Play
Big-cap tech stocks led the market lower on Friday, despite coming quarterly earnings releases. Was this a downward reversal or just quick correction before another leg up? It seems that the stock market will open virtually flat today, so there may be some more uncertainty after Thursday-Friday move down. There are still two possible medium-term scenarios.
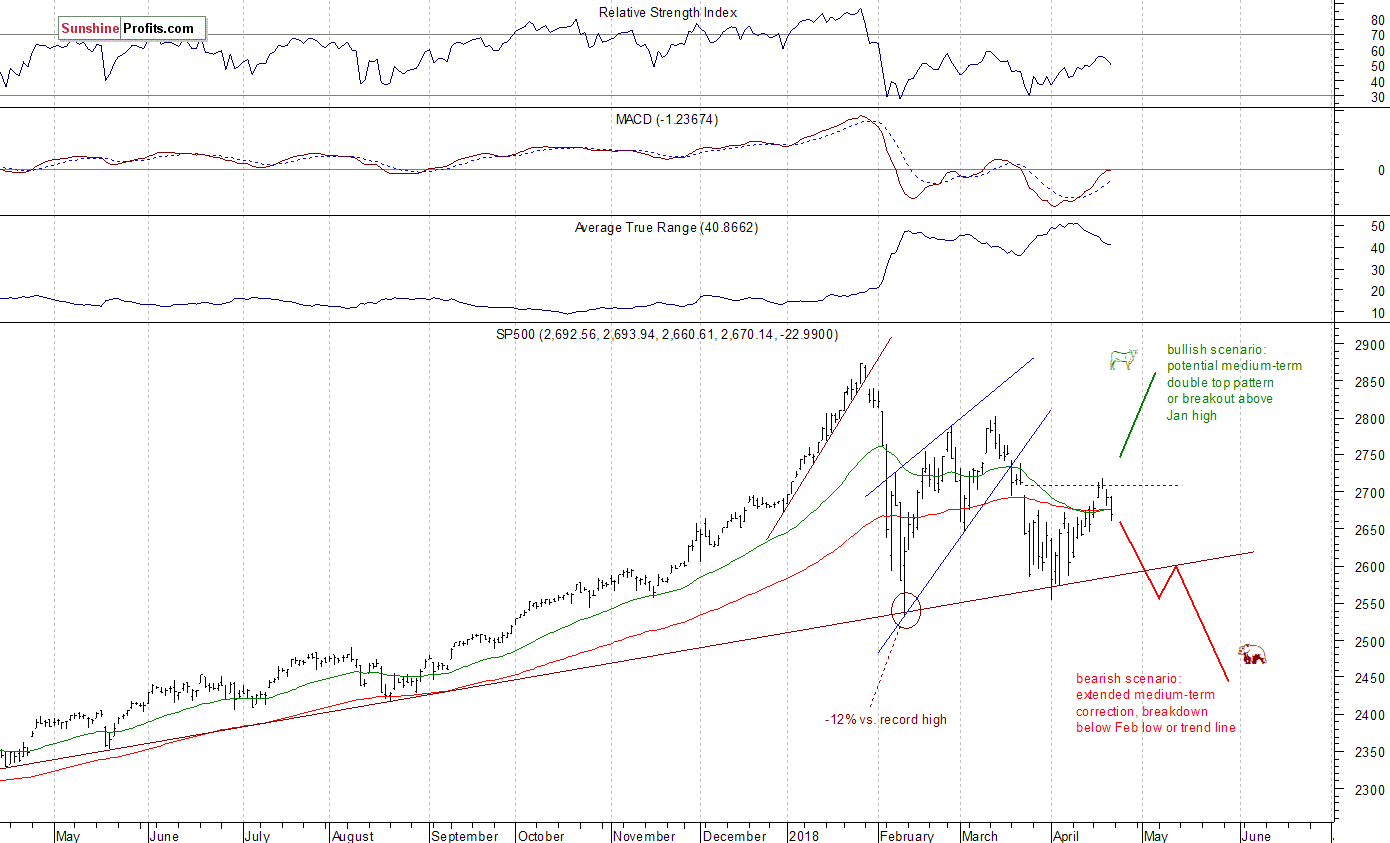
The U.S. stock market indexes lost 0.8-1.3% on Friday, extending their Thursday's move down, as investors' sentiment worsened despite quarterly earnings releases. The S&P 500 index fell below the level of 2,700 again and it currently trades 7.1% below its January 26 record high of 2,872.87. The Dow Jones Industrial Average lost 0.8% and the technology Nasdaq Composite lost 1.3%, as it was relatively weaker than the broad stock market on Friday.
The nearest important level of resistance of the S&P 500 index is now at around 2,685-2,695, marked by previous support level (last Tuesday's daily gap up of 2,686.49-2,692.05). The next level of resistance is at 2,700-2,705, marked by Thursday's daily gap down of 2,702.84-2,703.63. The resistance level is also at 2,715-2,720, marked by last Wednesday's daily high. On the other hand, the nearest important support level is now at 2,660-2,665, marked by recent local lows. The support level is also at 2,645-2,650.
Stocks remain in the middle of their over two-month-long consolidation following early February sell-off. The market bounced off its year-long medium-term upward trend line few weeks ago. Is this a bottoming pattern before another leg higher within the long-term bull market? Or just pause before another wave of selling? So, there are still two possible future scenarios - bearish that will lead us below February low following trend line breakdown, and the bullish one in a form of medium-term double top pattern or breakout towards 3,000 mark. Stocks bounced off the resistance level, and the index trades below 2,700 mark again:
Mixed Expectations, Investors Await Quarterly Earnings Releases
Expectations before the opening of today's trading session are virtually flat, because the index futures trade between 0.0% and +0.1% vs. their Friday's closing prices. The main European stock market indexes have been mixed so far. Investors will now wait for some economic data announcements: Flash Manufacturing PMI, Flash Services PMI at 9:45 a.m., Existing Home Sales number at 10:00 a.m. Stocks may fluctuate following Friday's decline. Investors' sentiment worsened after economic data releases, but investors will wait for quarterly earnings releases this week.
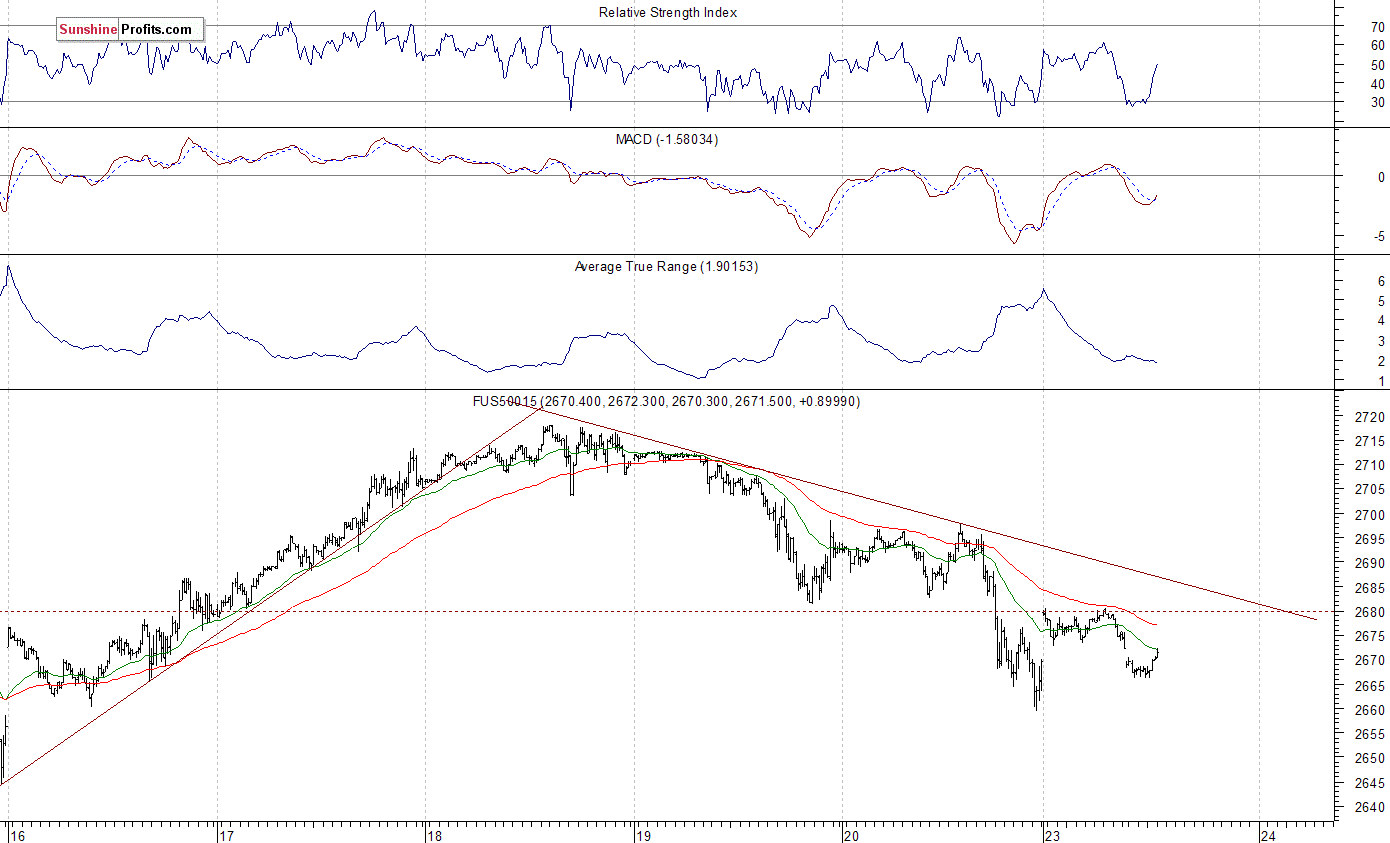
The S&P 500 futures contract trades within an intraday downtrend following an overnight move up. The market got closer to its Friday's local low. The nearest important level of support is at around 2,660-2,665. The next resistance level is at 2,645, marked by previous local low. On the other hand, the nearest important resistance level is at 2,680-2,685, marked by local highs. The futures contract is below its short-term downward trend line, as the 15-minute chart shows:
Nasdaq Below 6,700 Again
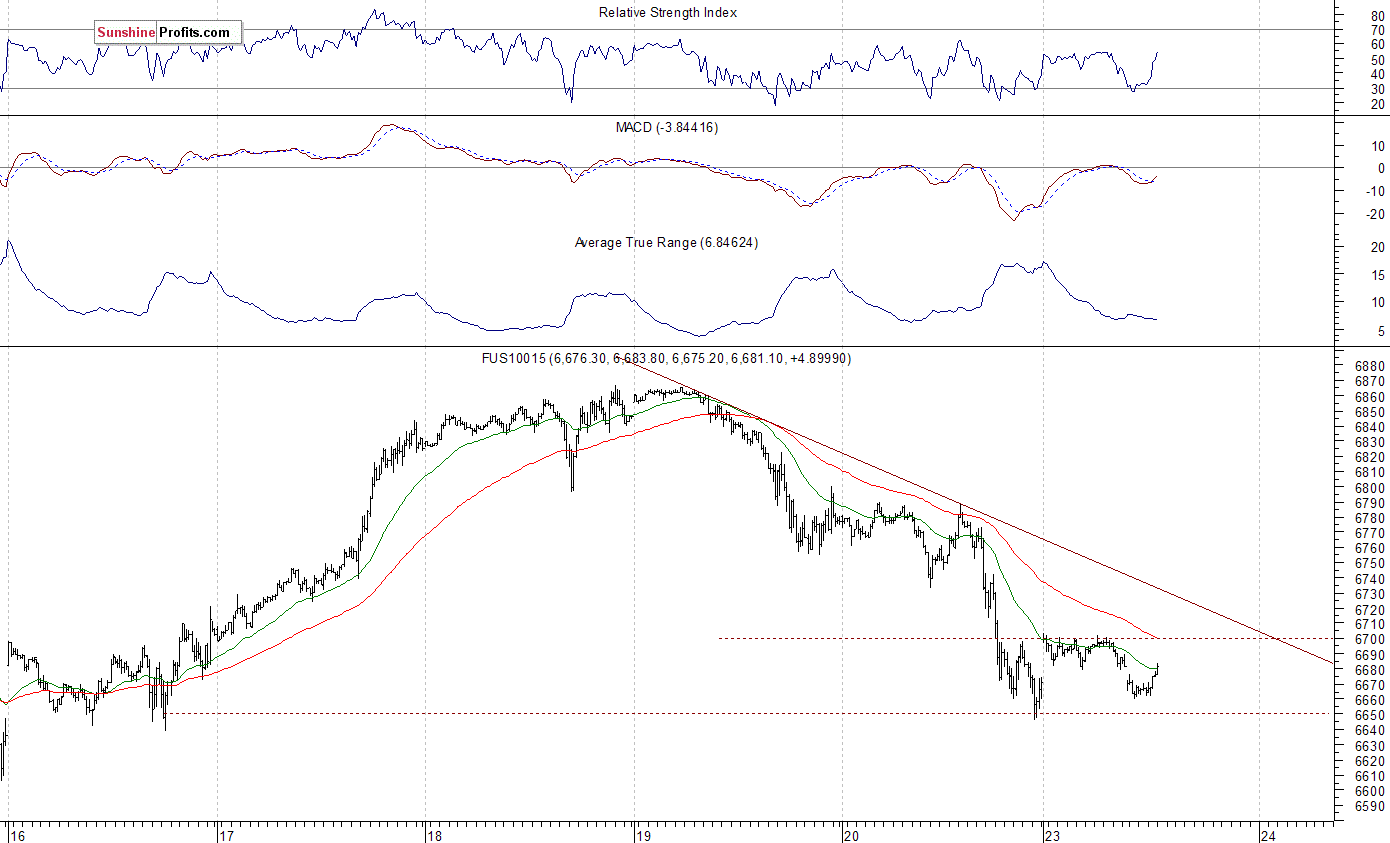
The technology Nasdaq 100 futures contract follows a similar path, as it trades closer to last Friday's local low. The market retraced its overnight move down. The nearest important level of resistance is at around 6,700-6,720. On the other hand, support level is at around 6,640-6,650. The Nasdaq futures contract trades within a consolidation along the level of 6,650-6,700, as we can see on the 15-minute chart:
Apple Sell-off, Amazon Relatively Strong, Earnings Play
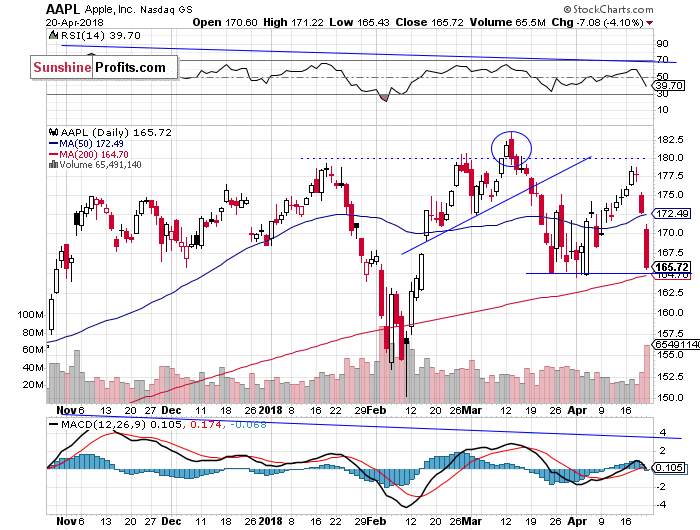
Let's take a look at Apple, Inc. stock (AAPL) daily chart. It sold off on Friday, following Thursday's move down. The market bounced off resistance level of $180 early next week, and it currently trades closer to support level of $165. If it breaks lower, we could see another wave of selling. Apple will release its earnings report on May 1, so expectations before that release seem to be quite negative. Will we see some "sell the rumor, buy the fact" action? The short-term downtrend will probably extend a little:
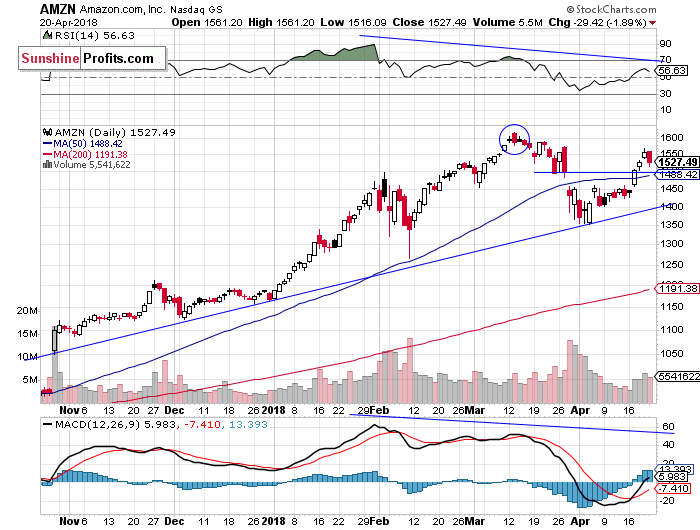
Now let's take a look at Amazon.com, Inc. stock (AMZN) daily chart. It remained relatively stronger than the broad stock market on Friday, as it traded close to its recent local high, above the price of $1,500. Will it reach its March record high again? Amazon will release its earnings report on April 26, and we see "buy the rumor, sell the news" action. Potential level of resistance is at around $1,500-1,600:
Blue-chip Stocks Short-term Correction
The Dow Jones Industrial Average broke above its medium-term downward trend line, and it got closer to 25,000 mark in the middle of last week. Since then, we are seeing a downward correction. The blue-chip index got back to its medium-term downward trend line. Will it act as a support level? It looks like the market could bounce here:
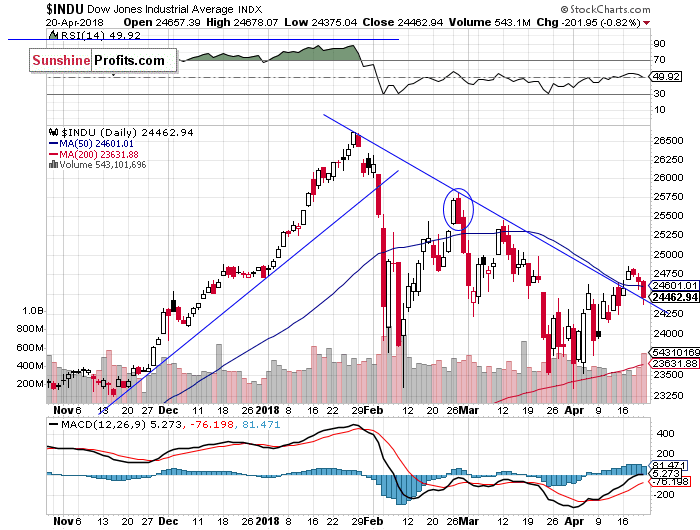
The early March rally failed to continue following monetary policy tightening, trade war fears, among others. What was just profit-taking action, quickly became a meaningful downtrend. Breakdown below over-month-long rising wedge pattern made medium-term bearish case more likely, and after some quick consolidation, the index accelerated towards its early February low. Just like we wrote in our several Stocks Trading Alerts, the early February sell-off set the negative tone for weeks or months to come. However, recent fluctuations were a bottoming pattern before upward reversal. Will uptrend resume following Thursday-Friday decline? Well, it looks like the last chance for bulls.
Concluding, the S&P 500 index will likely fluctuate today, as investors may hunt for stock prices bargains following Friday's sell-off. It still looks just like some downward correction within a new uptrend. Quarterly corporate earnings releases outweigh trade war fears, Syrian conflict escalation worries at this moment.
Want free follow-ups to the above article and details not available to 99%+ investors? Sign up to our free newsletter today!
Author

Paul Rejczak
Sunshine Profits
Paul Rejczak is a stock market strategist who has been known for the quality of his technical and fundamental analysis since the late nineties.


