Stocks get ready as Silver and Copper flash signals

Triangle-vertex-based reversal in copper worked like a charm.
The fake breakout was invalidated in tune with my yesterday’s comments:
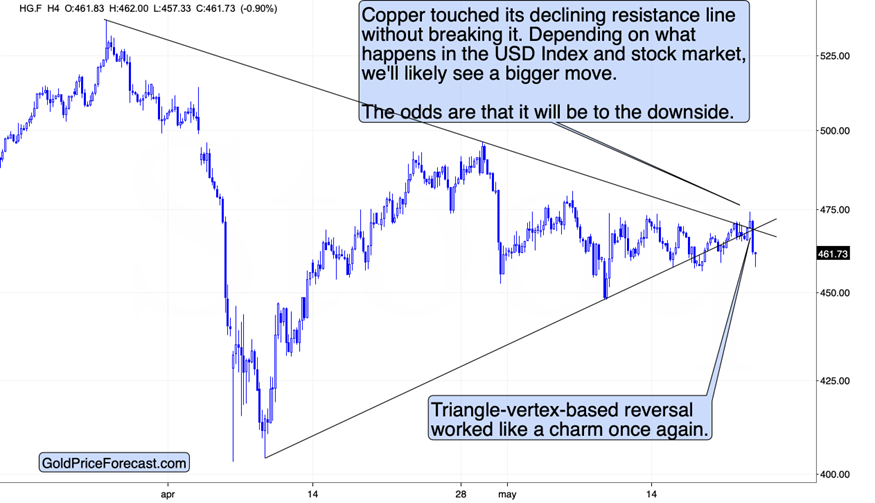
“The tension is rising on the copper market as the price is trading between its rising and declining resistance and support lines. It will have to break in one way or another and then confirm this move.
If the USDX just formed its bottom, copper likely formed its top. This means that we could see a breakdown below the declining resistance line any hour now. More importantly, this time, the breakdown could be confirmed.
There is another possibility for this week, as the triangle-vertex-based reversal for copper is due tomorrow. This means that – given copper’s very bearish picture for the medium term – we could see a fake move higher today and early tomorrow, which would then be reversed and the big decline would start then.”
So far, the decline is big only on an immediate-term basis, but the odds are that the move lower will become bigger shortly.
The reason is the invalidation of the breakout above the declining resistance line based on the March and late-April highs. Invalidations of breakouts are sell signals and given the situation in the USD Index and stocks, copper’s decline has much more sense than a rally.
Silver’s classic fake-out
Meanwhile, in silver’s case, we saw a classic.
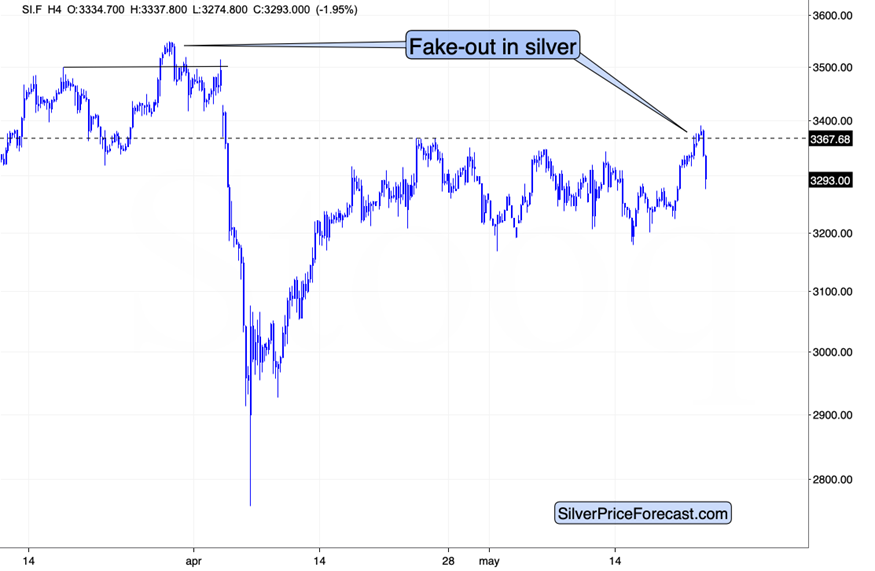
Silver’s fake-out is what is one of the more reliable technical signs on the precious metals market. Ironically, it’s what tricks most beginning investors that view breakouts in the white metal as something to be trusted.
That’s how the April slide started – with a fake-out in late March. We saw that once again yesterday and in today’s trading. This is a major “this is it” sign.
The monthly consolidation has probably just ended – the USDX and stocks provide key background for it, while silver and copper provide major short-term confirmations.
What was the trigger for all those moves?
The smoke-and-mirrors debt ceiling increase. I call it such, because it’s obvious that this ceiling will continue to be raised until some kind of major shift takes place (like replacing the USD and other currencies with government cryptos – so called CBDCs). This is obvious as nobody would want to take the blame for any kind of national insolvency or default. It’s a political theatre with the aim of convincing people that they really try to keep the budgets balanced and not trying to inflate everything away or kick the can further. In this way politicians (in general, I’m not commenting on any specific party) behave like a bunch of boys that haven’t grown up yet and can’t take accountability for their actions.
So, yes, the debt ceiling was increased. While it was obvious to me, it wasn’t obvious for the markets, and they are reacting today. To be precise, the writing was on the wall, what happened with the debt ceiling is simply a direct trigger for this action.
Finally, I’d like to share something from the Golden Meadow®’s comments feed (thank you Simon).
The chart below features gold fund flows.
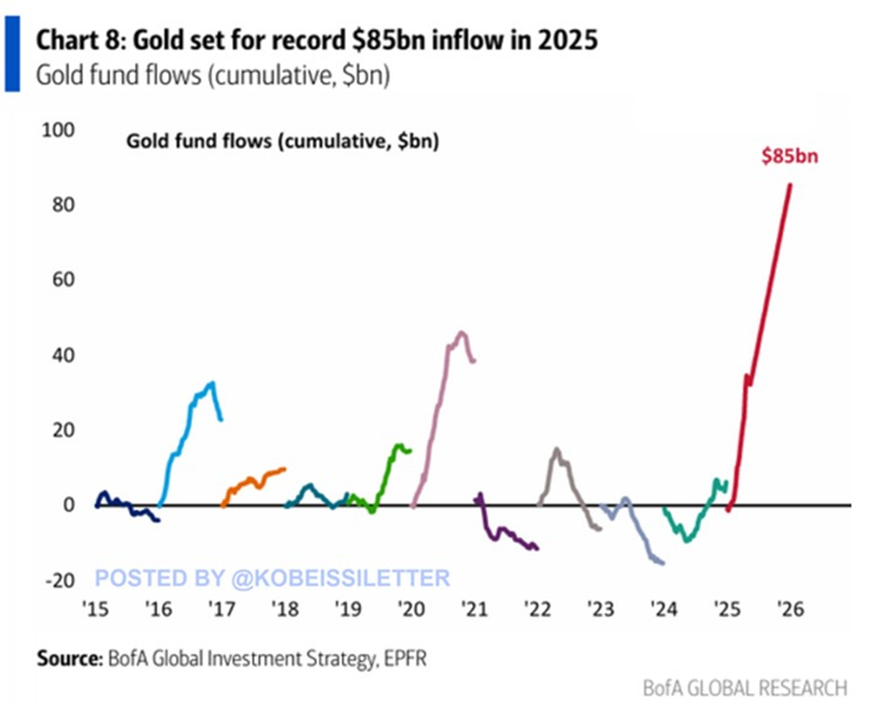
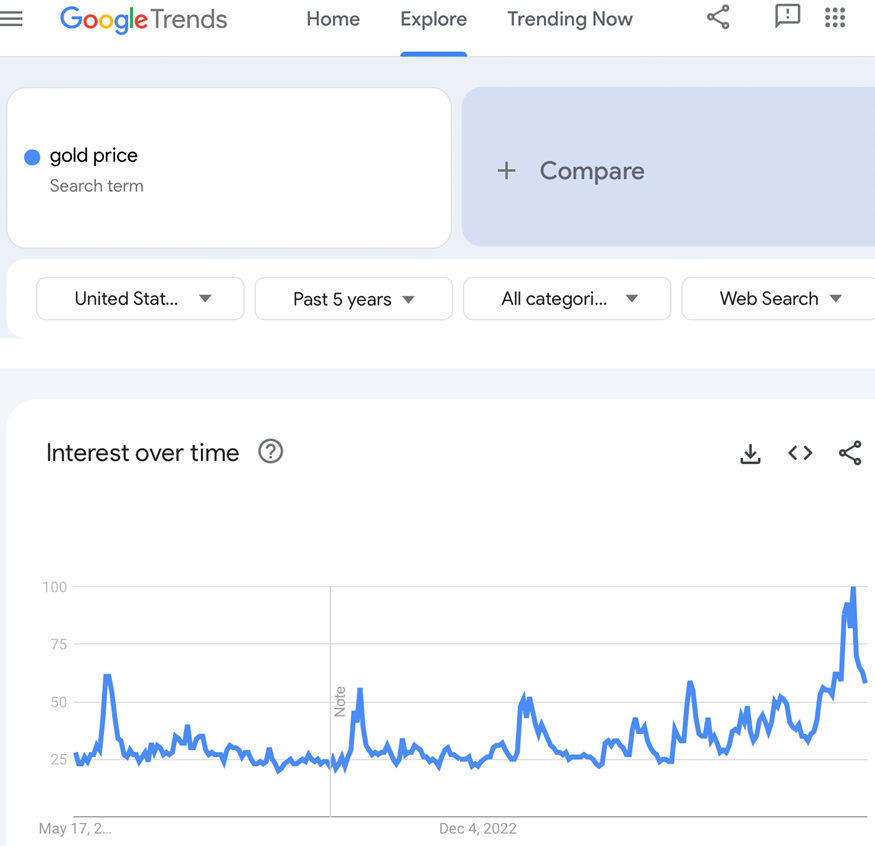
The increase in flows is connected with increased demand and purchases. Remember how I showed you the chart featuring interest in the “gold price” phrase in Google? It was huge – bigger than before and it was already moving back down. In fact, let me show it to you again.
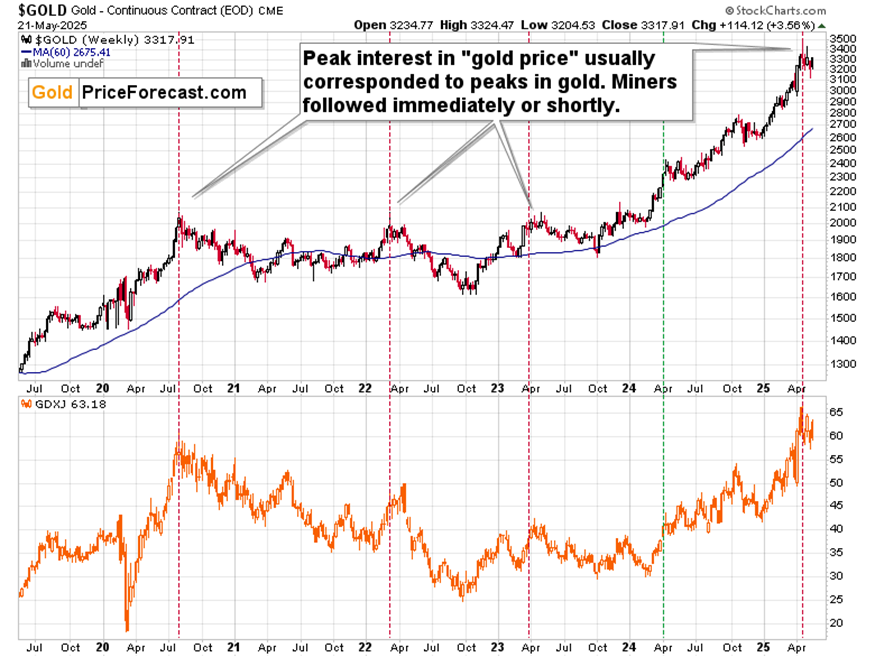
So… the conventional wisdom would have one think that increased flow of founds means high demand and therefore that the price will move higher.
This is only partially true, and this “partially” is very important. Because the reality is that this does show that the demand for gold is high – just as the sentiment is. And that means that the price of gold IS high, not that it has to or is likely to move even higher.
In order to say that gold will move even higher, one would need to be convinced that those flows or sentiment will keep increasing. Them being excessive is no reason to expect them to become even more excessive. In fact, if we already saw signs that the top formed (we already see that in searches, which is normal as the data for this is updated more frequently as it’s generally more recent), so the odds are that we’ll see reversal to the mean.
Gold’s future is bright
Here's the chart showing what happened to gold price and GDXJ prices after the previous major increases in gold fund flows.
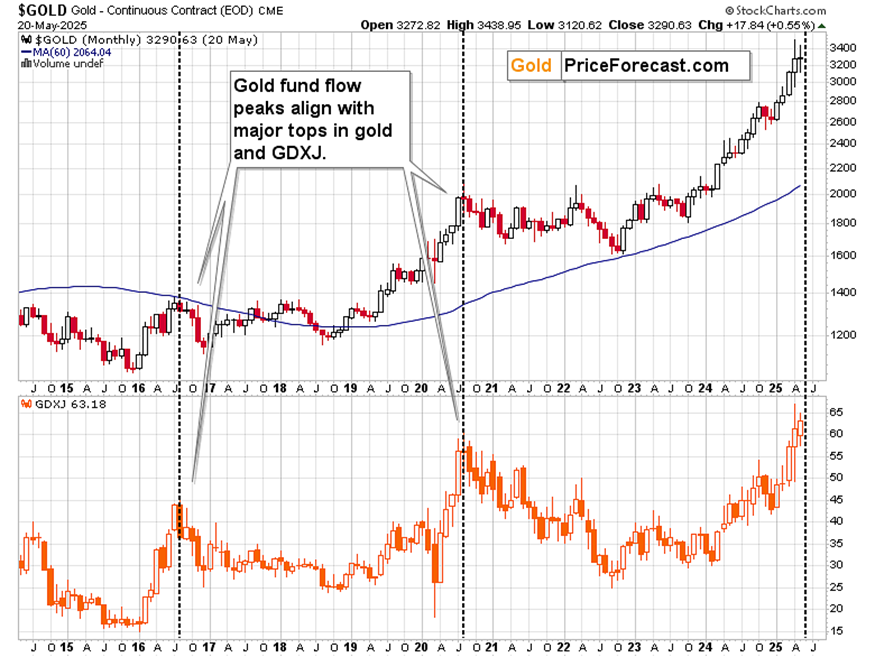
Yes, gold might have a super-bright future ahead of it (and the one for silver might be even brighter), but there are times when “enough is enough”. When the sentiment (which can be measured in many ways) peaks and so does the price. Then we see weeks or months of declines before the rally can continue.
Will the long-term rally in gold continue? Most likely yes – even though the zero-interest-rate-policy is over, it seems like the world is getting crazier every month. However, no market – not even gold – moves up without corrective declines – which can last for months. And which can – and are likely to be much bigger in case of mining stocks and silver, especially if stocks decline, too.
Want free follow-ups to the above article and details not available to 99%+ investors? Sign up to our free newsletter today!
Want free follow-ups to the above article and details not available to 99%+ investors? Sign up to our free newsletter today!
Author

Przemyslaw Radomski, CFA
Sunshine Profits
Przemyslaw Radomski, CFA (PR) is a precious metals investor and analyst who takes advantage of the emotionality on the markets, and invites you to do the same. His company, Sunshine Profits, publishes analytical software that any


