Stocks Fluctuate Along Record Highs - Topping Pattern Or Just Pause?

Briefly: In our opinion, speculative short positions are favored (with stop-loss at 2,410, and profit target at 2,200, S&P 500 index).
Our intraday outlook is bearish, and our short-term outlook is bearish. Our medium-term outlook remains neutral, following S&P 500 index breakout above last year's all-time high:
Intraday outlook (next 24 hours): bearish
Short-term outlook (next 1-2 weeks): bearish
Medium-term outlook (next 1-3 months): neutral
Long-term outlook (next year): neutral
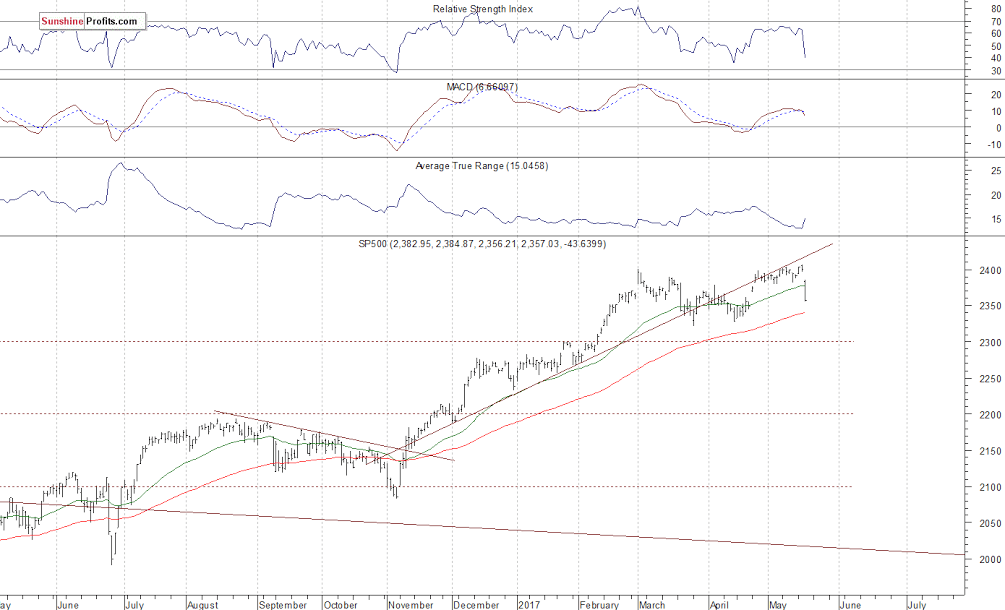
The U.S. stock market indexes lost 1.8-2.6% on Wednesday, breaking below their recent short-term consolidation, as investors reacted to U.S. politics news, among others. The S&P 500 index has reached new record high of 2,405.77 on Tuesday. However, it failed to continue the uptrend and sold off yesterday, following a gap down opening of the trading session. The Dow Jones Industrial Average got closer to level of 20,600 again, and the technology Nasdaq Composite index fell the most (-2.6%), as it got closer to 6,000 mark. The nearest important level of support of the S&P 500 index is now at 2,350-2.355, marked by late April daily gap up, among others. The next level of support is at 2,320-2,330, marked by previous local lows. On the other hand, resistance level is now at around 2,370, marked by previous level of support. The next resistance level is at 2,385-2,395, marked by yesterday's daily gap down of 2,384.87-2,396.05. The resistance level is also at 2,400-2,405, marked by the above-mentioned new record high. Is this a topping pattern before medium-term downward reversal? The uptrend accelerated on March 1 and it looked like a blow-off top pattern accompanied by some buying frenzy. The S&P 500 index trades below its medium-term upward trend line, as we can see on the daily chart:
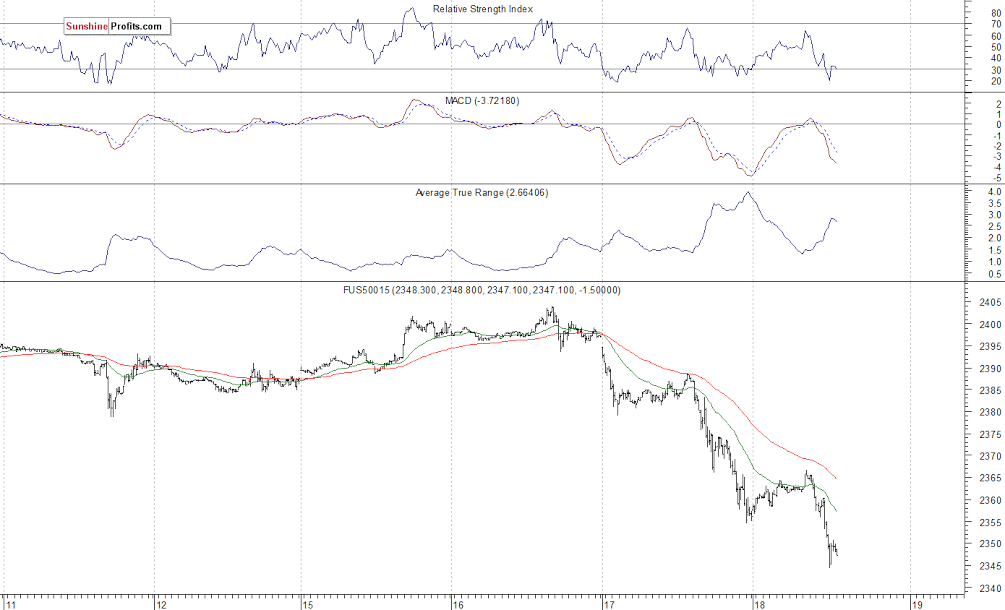
Expectations before the opening of today's trading session are negative, with index futures currently down 0.3-0.5%, as investors' sentiment remains bearish after yesterday's move down. The European stock market indexes have lost 0.9-1.4% so far. Investors will now wait for some economic data announcements: Initial Claims, Philadelphia Fed number at 8:30 a.m., Leading Indicators at 10:00 a.m. The market expects that the Philadelphia Fed number was at 18.5 in May, and the Initial Claims were at 240,000 last week. The S&P 500 futures contract trades within an intraday downtrend, as it extends its yesterday's sell-off. The nearest important level of resistance is at around 2,360-2,370, marked by an overnight consolidation. The next level of resistance is at 2,380-2,385, marked by short-term local highs. On the other hand, support level is at around 2,340, and the next support level is at 2,300-2,320, marked by some previous fluctuations. There have been no confirmed positive signals so far. But will the market continue its short-term downtrend? Or is this just a move down within an over two-month-long consolidation along new record highs?
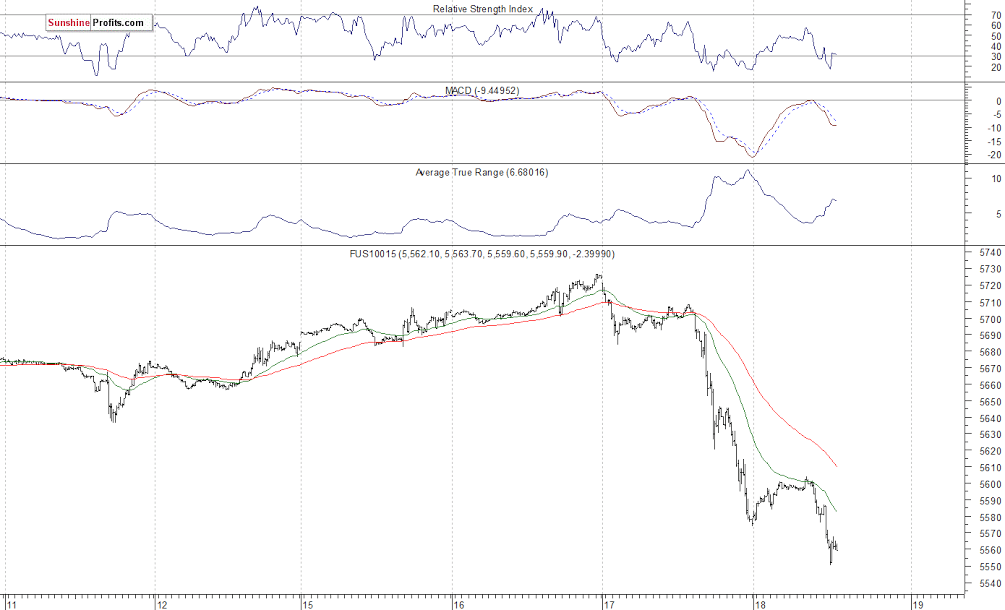
The technology Nasdaq 100 futures contract was relatively weaker than the broad stock market yesterday, as it retraced its few-week-long rally to new record highs above the level fo 5,700. It is now trading well below the level of 5,600. The nearest important level of support is at around 5,550, marked by an intraday local low. On the other hand, resistance level is at 5,600, and the next level of resistance is at 5,630-5,650, among others, as the 15-minute chart shows:Concluding, the S&P 500 index broke below its short-term consolidation on Wednesday, as it got closer to the level of 2,350, following Tuesday's move to new record high above 2,400 mark. Is this a new downtrend or just downward correction within an almost three-month-long consolidation? There have been no confirmed positive signals so far. For now, it looks like a new downtrend and the market may retrace more of its over year-long uptrend. We still can see medium-term negative technical divergences. Therefore, we continue to maintain our speculative short position (opened on February 15 at 2,335.58 - opening price of the S&P 500 index). Stop-loss level is at 2,410 and potential profit target is at 2,200 (S&P 500 index). You can trade S&P 500 index using futures contracts (S&P 500 futures contract - SP, E-mini S&P 500 futures contract - ES) or an ETF like the SPDR S&P 500 ETF - SPY. It is always important to set some exit price level in case some events cause the price to move in the unlikely direction. Having safety measures in place helps limit potential losses while letting the gains grow.
To summarize: short position in S&P 500 index is justified from the risk/reward perspective with the following entry prices, stop-loss orders and profit target price levels:
S&P 500 index - short position: profit target level: 2,200; stop-loss level: 2,410
S&P 500 futures contract (June) - short position: profit target level: 2,197; stop-loss level: 2,407
SPY ETF (SPDR S&P 500, not leveraged) - short position: profit target level: $220; stop-loss level: $241
SDS ETF (ProShares UltraShort S&P500, leveraged: -2x) - long position: profit target level: $15.47; stop-loss level: $12.98
Want free follow-ups to the above article and details not available to 99%+ investors? Sign up to our free newsletter today!
Author

Paul Rejczak
Sunshine Profits
Paul Rejczak is a stock market strategist who has been known for the quality of his technical and fundamental analysis since the late nineties.


