Stocks are heating up
In keeping with its historical performance, April has started off white-hot. We ended March, and Q1 for that matter, with more questions than answers.
But April 2021 started with a blowout jobs report, and the indices haven't looked back since. Right now, the S&P 500 is at yet another record, the Dow is just about at a record, and we've seen a furious comeback for Big Tech and growth stocks.
The sentiment is certainly better now than it was just a couple of weeks ago. However, I implore you to remember that every month in 2021 thus far has started off hot and saw a pullback/volatility occur in the second half of the month.
Think about it. In January, we had the GameStop trade spooking investors. In February and March, we had surging bond yields, inflation fears, or Jay Powell comments that rubbed people the wrong way. These concerns won't just disappear because we want them to. If we could make things magically disappear, COVID would've been over yesterday.
But, as I mentioned before, April historically is a strong month for stocks. According to Ryan Detrick , chief market strategist at LPL Financial, "Other than my Cincinnati Bengals breaking my heart, few things are more consistent than stocks higher in April."
During April, the S&P 500 has gained in 14 of the past 15 years. April has also been the strongest month for stocks over the past 20 years.
The market concerns, though, are still intact. We still have to worry about inflation, bond yields, and stocks peaking. According to Binky Chadha , Deutsche Bank's chief U.S. equity strategist, we could see a significant pullback between 6% and 10% over the next three months.
Another thing I'm a bit concerned about is the $2 trillion infrastructure plan. While this is great for America's crumbling infrastructure, do we really need to spend any more trillions?
Plus, how do you think this will be paid for? Hiking taxes- namely corporate taxes . Those gains that high growth stocks saw after Trump cut corporate taxes in 2017 could very well go away. While President Biden has indicated a willingness to negotiate his 28% corporate tax proposal, it's still a tax hike.
My goal for these updates is to educate you, give you ideas, and help you manage money like I did when I was pressing the buy and sell buttons for $600+ million in assets. I left that career to pursue one to help people who needed help instead of the ultra-high net worth.
With that said, to sum it up:
We're hot right now.
However, we could see more volatility and more muted gains than what we've come to know over the last year.
April is historically strong, but please continue to monitor inflation, yields, and potential tax hikes. Be optimistic but realistic. A decline above ~20%, leading to a bear market, appears unlikely. Yet, we could eventually see a minor pullback by the summer, as Deutsche Bank said.
Hopefully, you find my insights enlightening. I welcome your thoughts and questions and wish you the best of luck.
Russell 2000- still buyable?
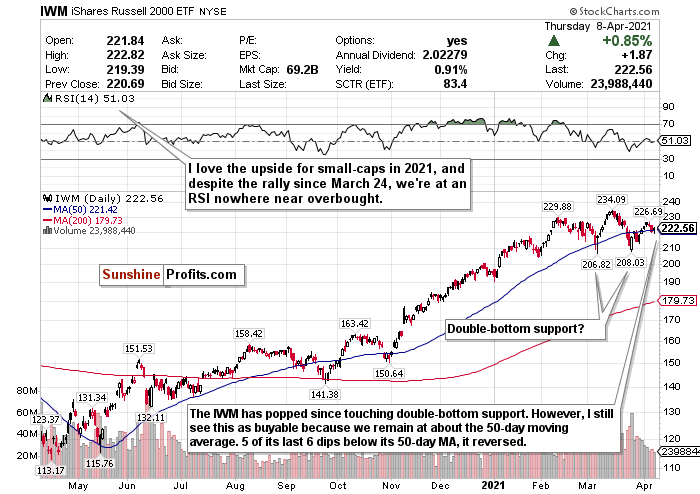
Figure 1- iShares Russell 2000 ETF (IWM)
I proudly switched my call on the iShares Russell 2000 ETF (IWM) to a BUY on March 24. I kicked myself for not calling BUY on the Russell after seeing a minor downturn during the second half of February and swore I wouldn’t make that mistake again.
We’re up to over 5% since then.
The climate right now supports the Russell 2000. The current economic policy is tailor-made for small-caps. The best part, though? The Russell is still very buyable.
The RSI is still hovering around 50. I also checked out the chart and noticed that almost every time the IWM touched or minorly declined below its 50-day moving average, it reversed.
Excluding the recovery in April from last year’s crash, 5 out of the previous 6 times the Russell did this with its 50-day, it saw a sharp reversal. The only time it didn’t was in October 2020, when the distance between its 50-day and its 200- day moving average was a lot more narrow.
Fast forward to now. The Russell 2000, despite its gains since tanking on March 23, remains right at about its 50-day moving average.
Aggressive stimulus, friendly policies, and a reopening world bode well for small-caps in 2021. I think this is something you have to consider for the Russell 2000 and maybe overpay for.
According to the chart, we may have found double-bottom support too.
Based on the chart and macro-level tailwinds, I feel that you can still BUY this index. In fact, it may be the most buyable of them all.
For more of my thoughts on the market, such as tech, inflation fears, and why I love emerging market opportunities, sign up for my premium analysis today.
Want free follow-ups to the above article and details not available to 99%+ investors? Sign up to our free newsletter today!
Want free follow-ups to the above article and details not available to 99%+ investors? Sign up to our free newsletter today!
Author

Matthew Levy, CFA
Sunshine Profits
After graduating with a Bachelor of Science in Economics from the University of Victoria in 2010, Matthew developed a passion for helping clients meet their financial freedom through strong, risk-adjusted portfolios.


