Stock Market is at a MAJOR fork in the road

April Review – “The S&P made a low on 3/27, had a retest of that low on 3/28 AM and then rallied late Thursday and Friday, 3/28 – 29, from Mercury Direct, which was 3/28 AM. The S&P closed near its high of the day on Friday’s close. This is almost the exact price action forecasted in our nightly e-mail updates. Our last update for March, Thursday night, 3/28, forecasted that it was likely the market would rally into the 3/29 weekend, but the rallywas probably not to be long lived, as we have a Planetary Polarity Point over the weekend, so the rally is likely to reverse on Monday, April 1. Typically, the S&P likes the Fibonacci .786 retracement level. The last decline, 2860 – 2785 was 75 handles. A .786 retracement projects to 2844 area, or about 10 handles higher than where it closed on Friday. If the S&P manages to get past the 2844 area, there should be very strong resistance at the 2860 level. IF the S&P can manage to take out the 2860 level, it is probably headed for a test of the all time high at 2941. Astrologically, there are two Planetary Polarity Points this month. These are potentially our most powerful change in trend windows. 4/10 PM – Jupiter in Sagittarius will turn Retrograde. 4/23 AC – Pluto in Capricorn will turn Retrograde. We are seeing some good tracking from our S&P Fractal Forecast, which you can see near the end of this letter. It is forecasting a consolidation pattern for April and May.”
Results –
Market Math – Sunday, 4/7 = 31,684 days = 178^2 days from the MAJOR 7/8/1932 low. This was the low day for the DJIA in the 1930s and therefore the bottom of the 1929 crash. 4/7 was a Sunday and Monday, 4/8 was a good short term high. Score – 1 out of 1 good date = 100%.
Fibonacci – 4/2, 4/15, 4/23-24, 4/26. 4/2 was not effective. 4/15 was a good one day low. 4/23 was very close in price and one day ahead of a short term high. 4/24 was a good short term high. 4/26 was close in price and one day past a short term low. Score – 4 out of 5 good dates = 80%.
Astro – 4/1, 4/2, 4/4, 4/5, 4/8, 4/10, 4/12, 4/15, 4/22, 4/24, 4/26 AC
4/1 and 4/2 were not effective. 4/4 was a good short term low. 4/5 was very close in price and one day ahead of a good short term high. 4/8 was a good short term high. 4/10 was close in price and one day past a short term low. 4/12 was a good short term high. 4/15 was a one day low. 4/22 was a good short term low 4/24 was a good short term high.
Score – 8 out of 10 good dates = 80%.
Total Score - 13 out of 16 good dates = 81.25%.
Additionally, the Polarity Adjusted Planetary Index I did an excellent good job of forecasting the track for the S&P
500 all month. Please see this later in this latter in the Planetary Index results chart section.
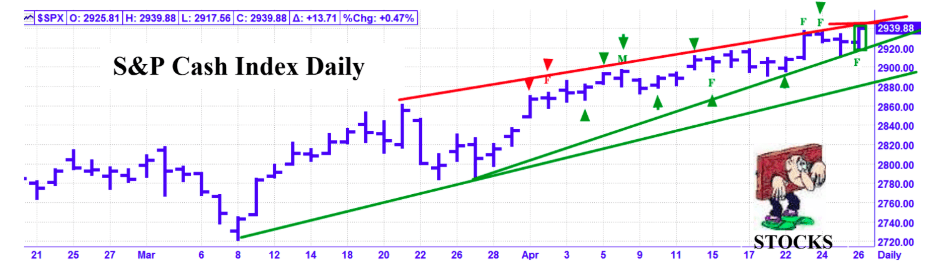
May Update – Technically, as of Friday, 4/26, the S&P 500 has rallied within about one handle of its all time high of 2940.91, which was achieved on 9/21/2018. This puts the S&P up against the top of its trading channel and at a major resistance level. Our most powerful category of planetary activity is what we call a Planetary Polarity Point. The usual pattern for these points is that the market will move to some extreme price position within one day of this point in time, and then usually reverse its trend. We have two of these this month. The first is that 4/29 AC – Saturn will turn Retrograde. This means that the S&P and the Stock Market is at a MAJOR fork in the road or inflexion point. By 4/30, the market is likely to either make a top and turn down or break out over the all-time high of 2941 and accelerate to the upside. Whatever trend is established at that time is likely to last for several weeks. Later in the month, we have 5/17 AC (weekend) – Mercury 0 Latitude, which is another Planetary Polarity Point, and a Full Moon, at which time we will be on alert for another possible major change in trend and probable trend reversal.
This is an excerpt from the Astro Trend newsletter. Astro-Trend covers about thirty futures related markets including the major Financial Markets, such as the Stock Market, T-Bonds, Currencies, and most major commodities. We also offer intra day data which identifies potential change in trend points to the minute.
Author

Norm Winski
Independent Analyst
www.astro-trend.com


