Stock futures just went red on the CPI. Here's what the bond market is pricing that equities haven't caught up to

Since late June, the bond market has been pricing in a Federal Reserve (Fed) that keeps raising rates into 2027, and most US stocks have already been marked down for it. The S&P 500 hasn't, because a handful of AI-linked giants make up much of the index and their prices haven't followed the rest. The 10-year Treasury yield has risen a full percentage point in that time, to its highest level since 2002. The S&P 500 set a record close on October 6, the day after the 30-year yield posted its highest close in more than 24 years.
The September Consumer Price Index (CPI) came in above forecast on Wednesday. Prices rose 3.7% year over year, above the 3.6% forecast, and the core measure, which strips out food and energy, rose 2.6% against 2.5%. Stock futures went red on the release. The bond market has already priced what the S&P 500 is only starting to: a Fed that raises rates past its own projections, and a 10-year yield that pays as much as the index's companies earn.
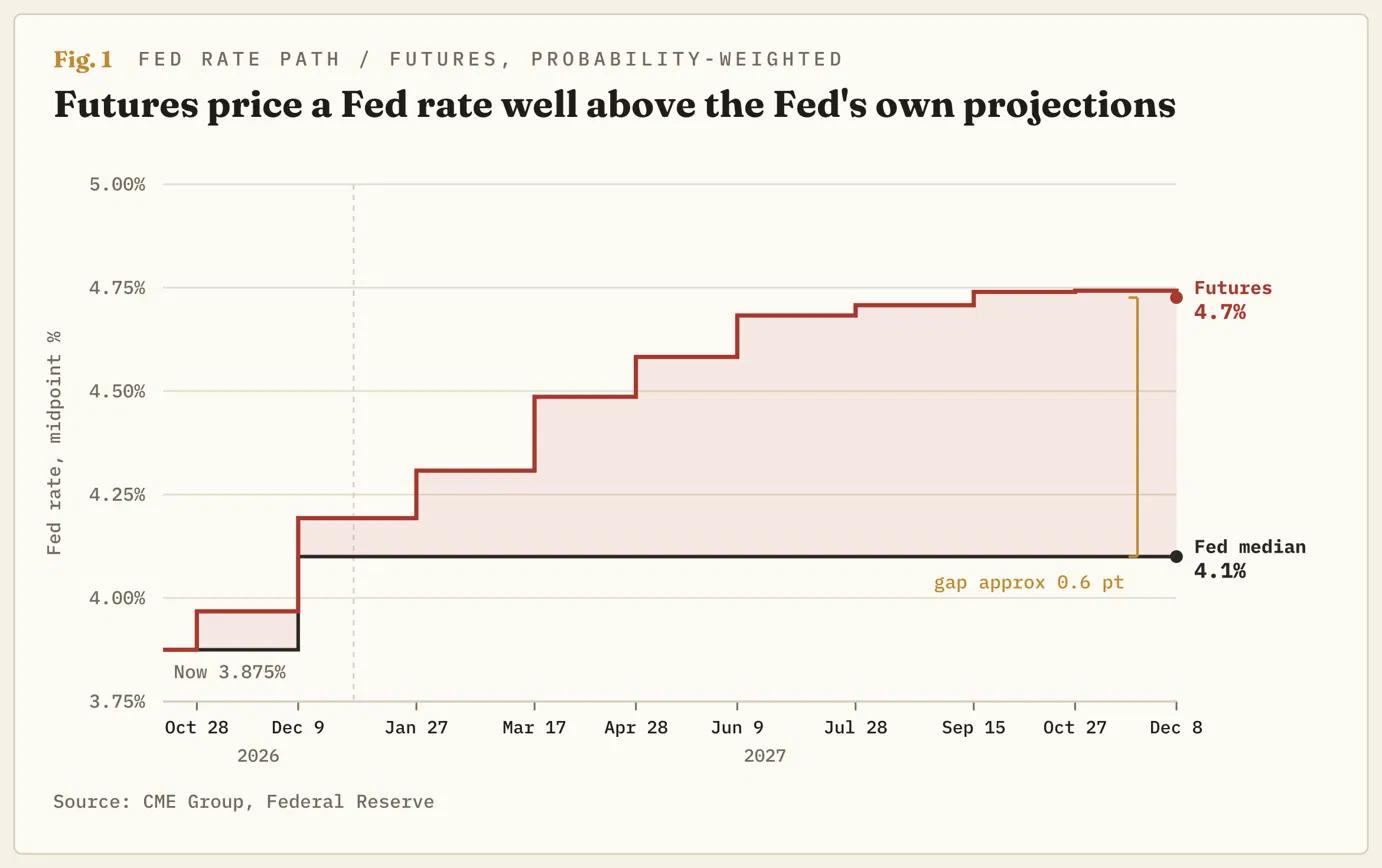
Futures have the Fed hiking past its own forecasts
The Fed raised its rate in September for the first time since July 2023, moving it from 3.50%-3.75% to 3.75%-4.00%. The two-year Treasury yield, which follows where traders expect the Fed's rate to go, is just above 4.8%. That's almost a full point above the 3.875% midpoint of the Fed's new range. Every hike priced into that yield raises what a buyer can lock in on a two-year bond, rather than an S&P 500 fund paying about 1% in dividends.
After the release, the chance of a hike at the October 27-28 meeting rose from about 22% to 37% on CME Group's FedWatch tool, which reads the odds off futures prices. At least one hike by the December 9 decision is fully priced.
Further out, futures price the Fed's rate at 4.50%-4.75% by April 2027, three more quarter-point hikes, and no meeting from June 2027 onward. The Fed's own September projections stop at 4.00%-4.25%. That leaves about two hikes in 2027, a year in which New York Fed President Williams sees no need for any.
Stocks now yield what a government bond pays
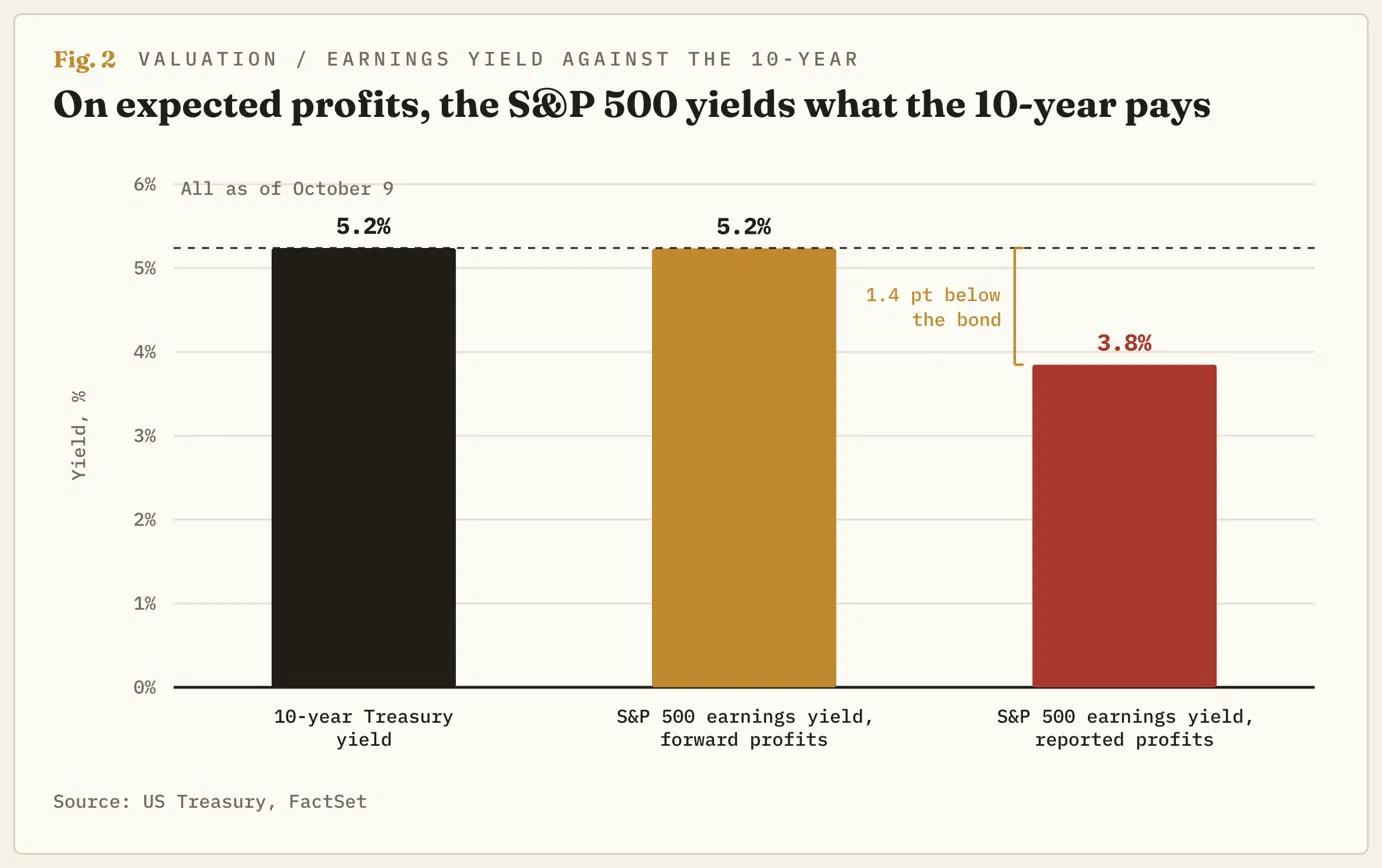
The S&P 500 trades at about 19 times the profit analysts expect its companies to make over the next twelve months. Turn that around, and each Dollar in the index buys about 5.2 cents of expected yearly profit, which is its earnings yield. The 10-year Treasury pays about 5.2% a year, and the US government is a safer borrower than any company in the index.
That earnings yield normally runs above the 10-year, and the gap is what investors get paid for taking company risk instead of government risk. On the profits companies have actually reported over the past year, the earnings yield is about 3.8%, almost a point and a half below the bond. For the gap to reopen, the 10-year has to fall, profits have to beat forecasts, or the index has to come down. Bought at current prices, an S&P 500 fund earns about what the bond pays and adds the risk of a bad earnings season at no extra charge.
The S&P 500's September came down to six stocks
In September, the S&P 500 fell 0.5% and its equal-weighted version, which gives every company the same slice, fell 5%, according to Morgan Stanley. The six biggest contributors added about 1.9 percentage points to the index, and the rest took away about 2.4. Morgan Stanley puts the typical core AI and chip stock at about 32 times expected profit, down from 38 three months ago because profits grew faster than prices. That's an earnings yield near 3.1%, which makes the stocks keeping the index near its record the ones furthest behind the bond.
The ten biggest companies make up about 37% of the S&P 500, a larger share than at the 1973 or 2000 peaks. The Dow Jones Industrial Average is weighted by share price, so the biggest companies count for far less. Dow futures have fallen almost 6% from their August 5 record while the S&P 500 set new highs in October.
Fund managers have named the yield that moves them
Bank of America's October survey of fund managers found 37% would consider moving money from stocks into bonds once the 10-year reaches 6%. Another 19% said yields are already high enough. BlackRock has started, raising short-term Treasuries to overweight, meaning it holds more of them than its benchmark, and paying for part of that by cutting US stocks to neutral.
A manager moving into a 6% bond gives up the least by selling the stocks that earn the least on their price, the AI giants at about 3%. The 10-year is about three-quarters of a point from the yield that would move over a third of those managers.
Below 7,800, the lean is lower
The bond market may have priced in two hikes too many, and BlackRock upgraded short-term Treasuries on that view, but the S&P 500 is priced as if that has already been proven. The October 27-28 Fed meeting, the October CPI on November 10 and the December 9 decision are where it gets tested.
S&P 500 futures traded between 7,800 and just under 7,900 from October 6 to October 13, a run of lower highs under the record. The daily Stochastic Relative Strength Index (Stoch RSI), a momentum gauge, had already turned down before the release. The CPI drop took futures through 7,800, the floor of that range, and retraced more than a third of the rally from the mid-September low near 7,600.
7,800 is the line. Below it, the lean is lower, with 7,700, the floor of the late-September range, first and the mid-September low near 7,600 after it. A daily close back above 7,900 is a new record with the 10-year above 5%, and the case is wrong.
Both yields jumped on the release and stopped short of their highs, the two-year just under its late-September peak and the 10-year below its October 7 high. Each has since retraced most of the jump, and their momentum gauges have fallen since the start of October. A daily close above 5.40% on the 10-year is new 24-year ground and pushes the S&P 500's earnings yield further behind the bond. A two-year close below 4.70%, the early-October low, would mean traders are taking hikes back out of the Fed path, and the gap between the S&P 500 and the bond would close without the index falling.
Author

Joshua Gibson
FXStreet
Joshua joins the FXStreet team as an Economics and Finance double major from Vancouver Island University with twelve years' experience as an independent trader focusing on technical analysis.