Gold should cost $11,969 per ounce, and Silver should be $1,515 per ounce – Here is why

High oil prices, rising inflation readings, and therefore hawkish central banks… All these factors have badly impacted the precious metals markets. But investors cannot see the big picture the US economy is facing. The surging debt and the rising money supply are the real upside factors for both gold and silver.
US national debt
Source: US Debt Clock.org
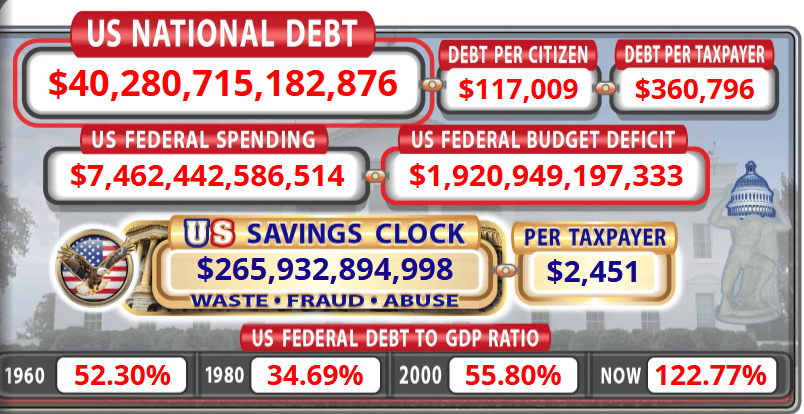
As I have written in my previous publications, US national debt has recently surpassed the $40 trillion mark. The debt-to-GDP ratio has been substantially above the critical 100% mark for a while, which makes it very expensive to service thanks to the higher rates for longer. It is now around 123%, substantially above the 52.31% reported in 1960, 34.68% reported in 1980, or even the 55.85% in 2000.
Rising national debt is the direct result of many years of budget deficits recorded in the US. High debt obviously leads to more money printing by the Fed to service that debt.
Money supply
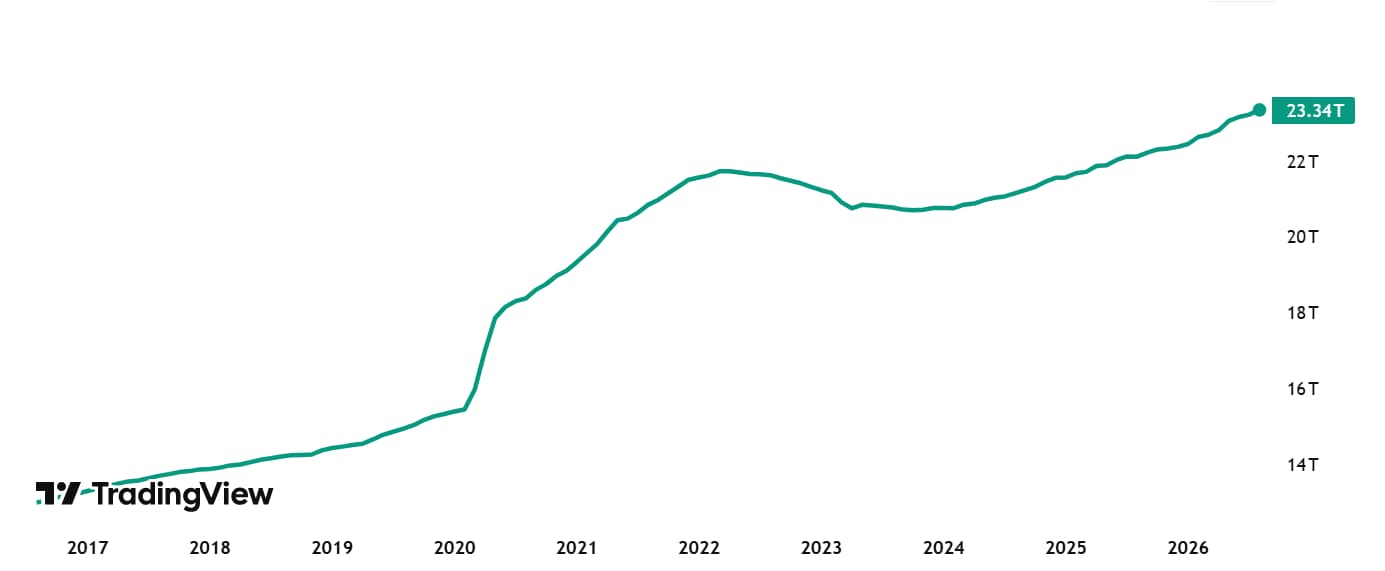
That is why over the past ten years, the US M2 money supply has increased by $10 trillion to reach $23.34 trillion. Particularly dramatic was the 2020 pandemic surge, which happened during the unprecedented quantitative easing (QE) program taken by the Fed to get the paralyzed economy going. Every time the Fed launches its QE program, the money supply rises.
Source: TradingView
How much should precious metals cost?
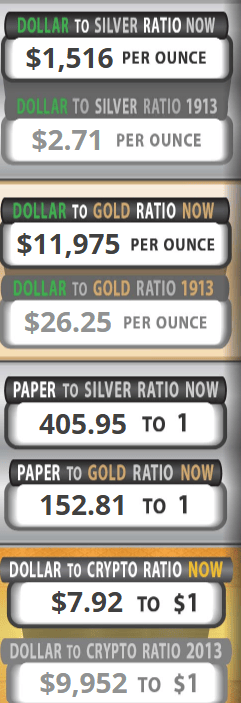
According to the US Debt Clock.org website, given the amount of liquidity there is in the US economy, silver should cost $1,515 per ounce, while gold should cost no less than $11,969 per ounce. The dollar-to-silver and the dollar-to-gold ratios are the following:
Source: US Debt Clock.org
In other words, for every ounce of gold there are 11,969 US dollars, while for every ounce of silver there are 1,515 US dollars.
Also, as can be seen from the excerpt above, it is highly risky to hold precious metals in paper form: the paper-to-silver ratio is a whopping 406. This suggests that for every ounce of physical silver, there are 406 ounces of paper silver. As for gold, there are 153 ounces of paper gold for every physical ounce of the yellow metal.
But it does not mean that gold and silver prices rise merely to cover for inflation.
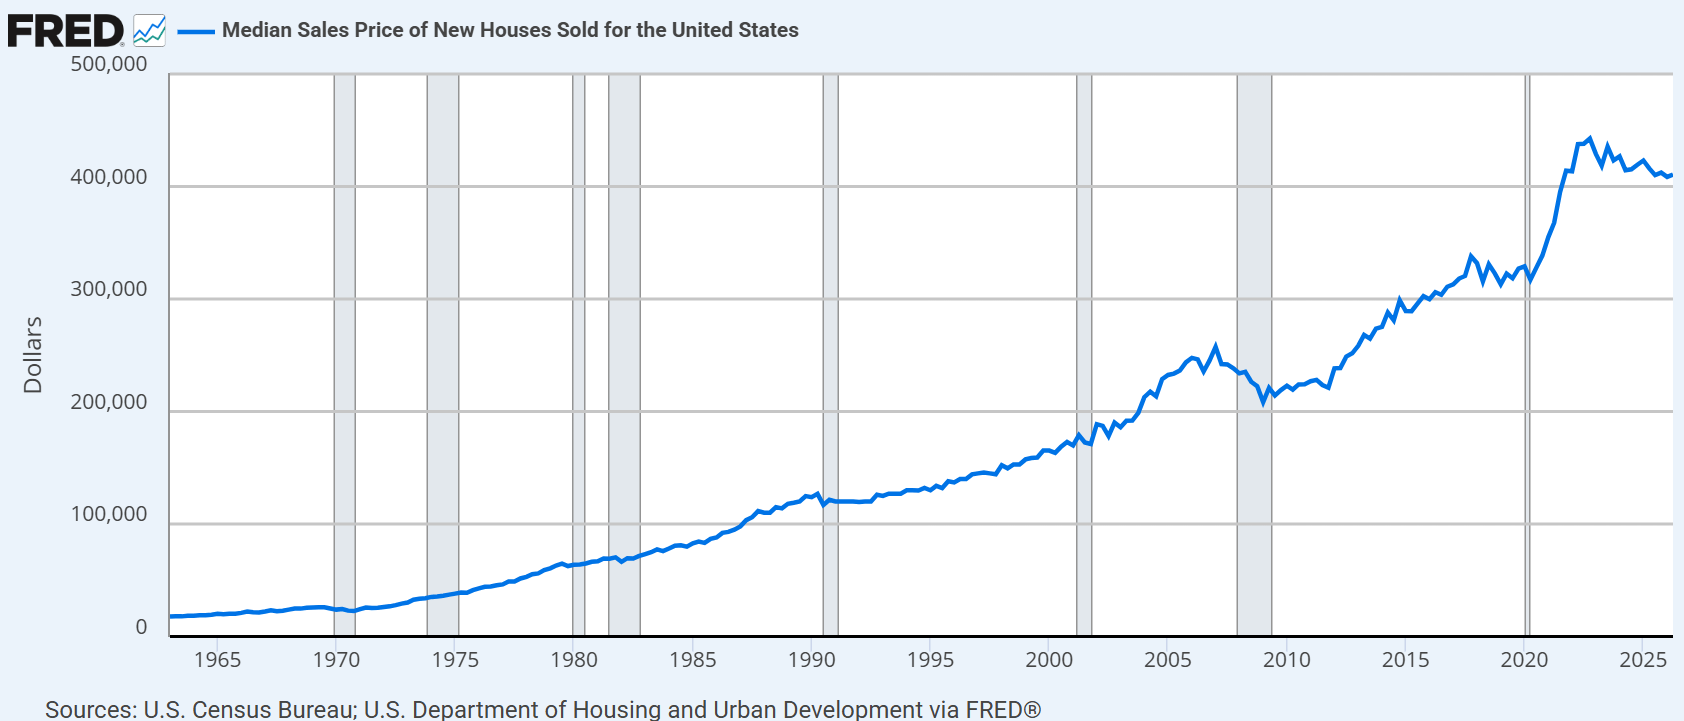
Below is a diagram showing the median house prices in the US.
Median house price in the US history
Source: The Federal Reserve
Right now, the median house price in the US is lingering near the $400,000 mark. Let us divide that number by the current silver price of $60 per ounce. We will get 6667 silver ounces that can be used to buy a house.
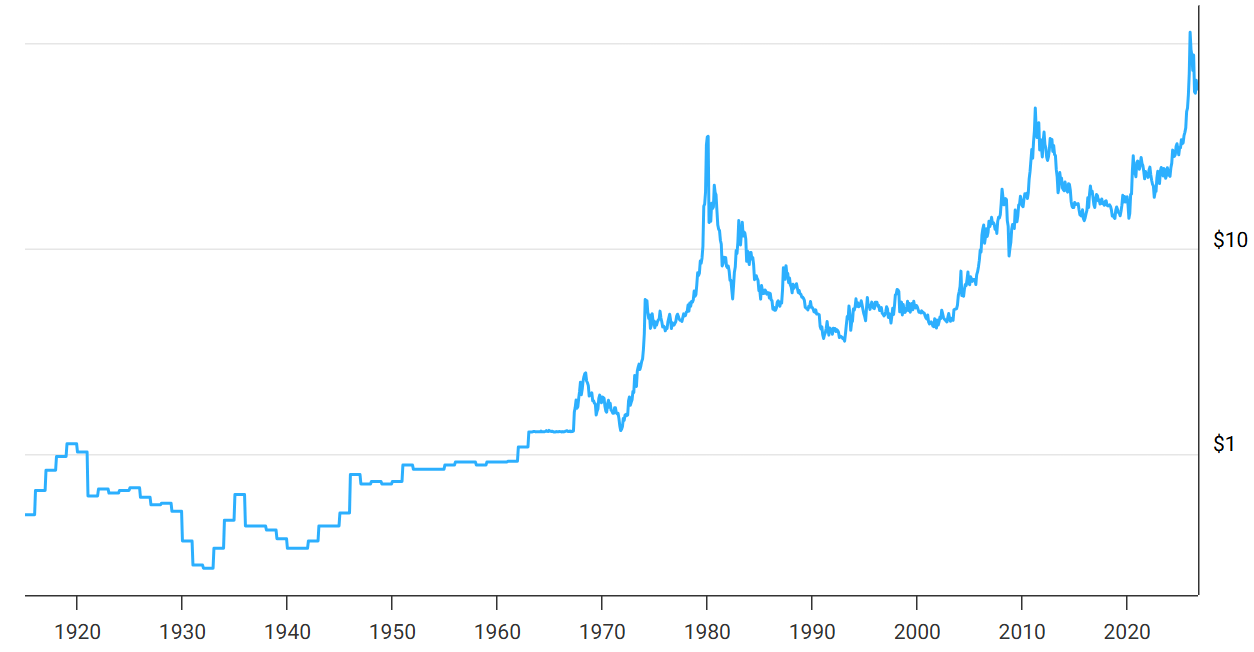
Historical silver prices
Source: Macrotrends
In 1980, the average house price was $64,000; in 2000, it was $170,000, while in 2011 it was $200,000. In 1980, silver cost $32 per ounce; in 2000 it was worth $5 per ounce, while in 2011 it was $40.
So, in 1980, you could have bought a house with just 2,000 ounces of gold; in 2000, the price was a whopping 40,000 silver ounces, while in 2011 it was 5,000. So, silver does not appreciate with inflation. It is a volatile precious metal, and it does not move in the same direction as house prices.
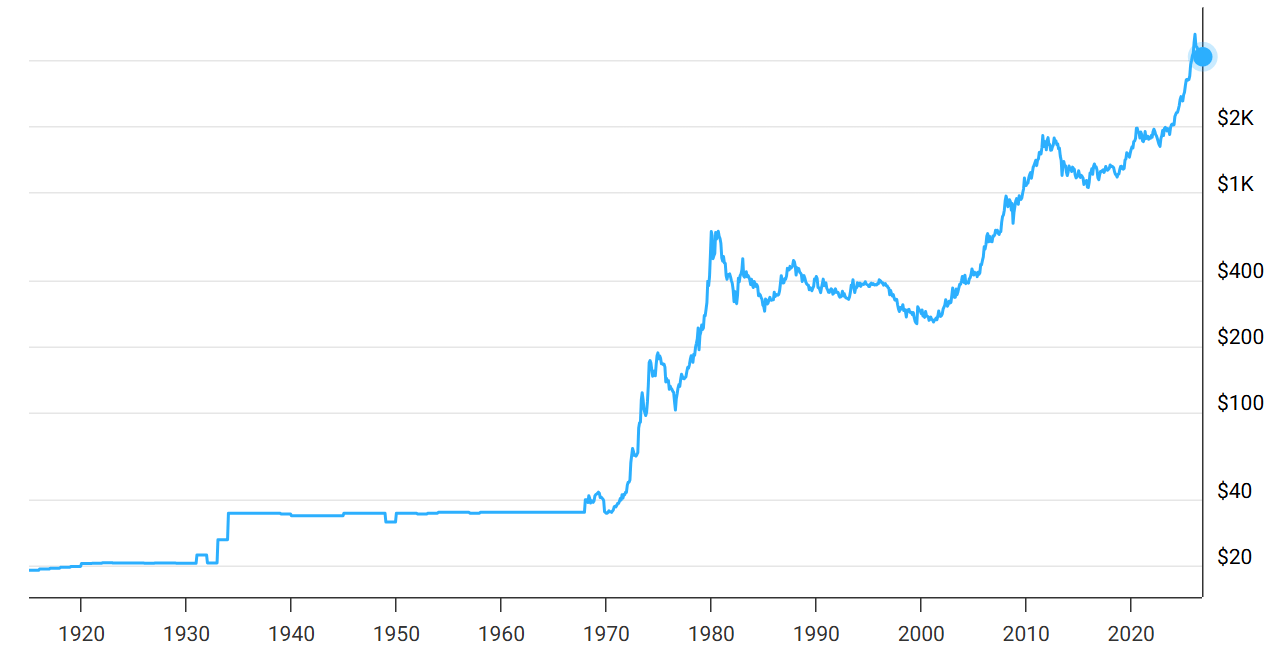
House prices can also be measured in gold ounces.
Gold prices history
Source: Macrotrends
In 1980, gold cost $500 per ounce; in 2000, $270; in 2011, $1,700. Let us divide the average house prices by the per-ounce gold prices recorded in each of these years. In 1980, it was possible to buy a house with just 128 ounces; in 2000, 630, while in 2011 it was possible with just 118. Again, gold prices surge and fall, not in accordance with inflation or other asset prices.
Conclusion
The US debt and the money supply are surging fast, thus making precious metals seem even more attractive to investors than they used to be in the past. Given the M2 money supply, silver price should be $1,515 per ounce, while gold should cost no less than $11,969 per ounce. But it is important to know that gold and silver prices do not only move in accordance with inflation, and silver is much more volatile than gold.
Author

Anna Sokolidou
Independent Analyst
A research analyst, a freelance finance writer and an economics teacher looking for interesting investment opportunities. I have been investing for years. I am mostly interested in writing about commodities, precious metals and large corporations.