Stim bill? – Almost there

Good Morning Traders,
As of this writing 5:45 AM EST, here’s what we see:
US Dollar: June USD is Down at 100.485.
Energies: April'20 Crude Down at 23.68.
Financials: The June'20 30 year bond is Up 40 ticks and trading at 179.00.
Indices: The March S&P 500 emini ES contract is 188 ticks Lower and trading at 2419.00.
Gold: The April '20 Gold contract is trading Down at 1623.20. Gold is 102 ticks Lower than its close.
Initial Conclusion
This is not a correlated market. The dollar is Down- and Crude is Down- which is not normal but the 30 year Bond is trading Higher. The Financials should always correlate with the US dollar such that if the dollar is lower then bonds should follow and vice-versa. The S&P is Lower and Crude is trading Lower which is not correlated. Gold is trading Lower which is not correlated with the US dollar trading Down. I tend to believe that Gold has an inverse relationship with the US Dollar as when the US Dollar is down, Gold tends to rise in value and vice-versa. Think of it as a seesaw, when one is up the other should be down. I point this out to you to make you aware that when we don't have a correlated market, it means something is wrong. As traders you need to be aware of this and proceed with your eyes wide open.
At this time all of Asia is trading Lower with the exception of the Indian Sensex exchange which is Higher. Currently all of Europe is trading Lower.
Possible Challenges To Traders Today:
Durable Goods is out at 8:30 AM. This is Major.
Core Durable Goods is out at 8:30 AM EST. This is Major.
HPI is out at 9 AM EST. This is Major.
Crude Oil Inventories is out at 10:30 AM EST. This is Major.
Treasuries
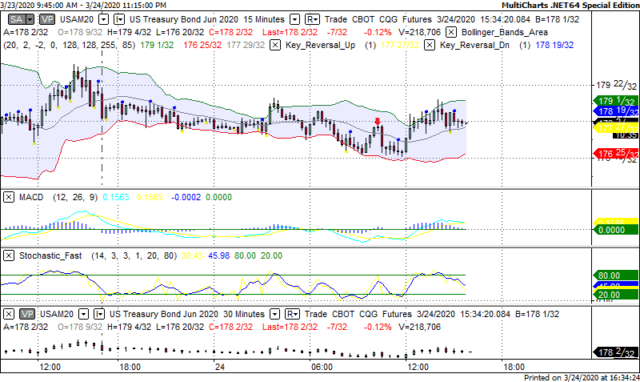
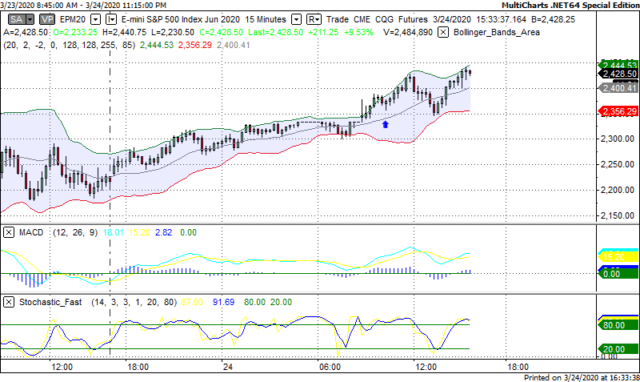
We've elected to switch gears a bit and show correlation between the 30 year bond (ZB) and The S&P futures contract. The S&P contract is the Standard and Poor's and the purpose is to show reverse correlation between the two instruments. Remember it's liken to a seesaw, when up goes up the other should go down and vice versa.
Yesterday the ZB made a move at around 10:15 AM EST. The ZB hit a High at around that time and the S&P moved Higher. If you look at the charts below ZB gave a signal at around 10:15 AM and the S&P moved Higher at around the same time. Look at the charts below and you'll see a pattern for both assets. ZB hit a High at around 10:15 AM EST and the S&P was moving Lower shortly thereafter. These charts represent the newest version of MultiCharts and I've changed the timeframe to a 15 minute chart to display better. This represented a Shorting opportunity on the 30 year bond, as a trader you could have netted 30 plus ticks per contract on this trade. Each tick is worth $31.25. Please note: the front month for the ZB is now June '20. The S&P contract is now June '20 as well. I've changed the format to Renko bars such that it may be more apparent and visible.
Charts Courtesy of MultiCharts built on an AMP platform.
Bias
Yesterday we gave the markets an Upside bias as both the USD and the Bonds were trading Lower yesterday morning and this usually reflects an Upside day. The Markets didn't disappoint as the Dow gained 496 points, the S&P gained 28ut the Nasdaq dropped 34. Today we aren't dealing with a correlated market and our bias is Neutral.
Could this change? Of Course. Remember anything can happen in a volatile market.
Commentary
So it appears as though the rally that started Tuesday continued yesterday as the markets were awaiting confirmation of a signed stimulus package. Unfortunately that didn't happen as the House of Representatives must vote and approve it before it goes to the President for signature. The markets did stay on the positive side for the most part regardless. Today we have the Unemployment Claims and everyone is expecting this number to be sky high as the pundits have already suggested millions to be unemployed due to the coronavirus shutdown. Time will tell if this is the case.
Author

Nick Mastrandrea
Market Tea Leaves


