Sterling under pressure as pressure mounts on Theresa May

Market Overview
The concerns over how tax reform is going to pan out in the US and the potential slippage in terms of delivery is impacting on equity markets. This helped to pull equities lower into the close on Friday and continues to hang over the markets into the new trading week. There has been a strong rebound on longer dated Treasury yields which has pulled the 10 year back towards 2.4% and this has helped to stabilise the dollar once more as yield differentials are again pulled back in the favour of the dollar bulls. However this is more part of a recent consolidation amongst the forex majors and unless there is a sustainable move above 2.4% on the 10 year Treasury yield, it is difficult to see too much positive traction in the near term. Brexit continues to be a drag on sterling however, with the EU negotiators ratcheting up the pressure. Beleaguered UK Prime Minister Theresa May is meeting Brussels officials today in an attempt to push the process along. However there seems little appetite from within the EU to help her, as she continues to fight fires both at home and abroad. Reports that the number of Mrs May’s own Conservative MPs ready to oust her are growing, do little for stability. Sterling subsequently remains a key mover on the fractured UK politics and a strong move to the downside already this morning does not suggest that traders are overly confident of a positive outcome. This is in turn still a driver in the performance of FTSE 100 with the negative correlation still in play again today.

Wall Street closed lower on Friday with the S&P 500 -0.1% at 2582 whilst Asian markets were mixed on Monday morning (Nikkei -1.3%). European markets are ticking higher marginally higher, with FTSE 100 outperforming on sterling weakness. The forex markets show little real discernible trend other than sharp sterling weakness today. In commodities there is little real direction, with gold and silver holding support, whilst oil is also mildly positive.
There are no major economic announcements today.
Chart of the Day – FTSE 100
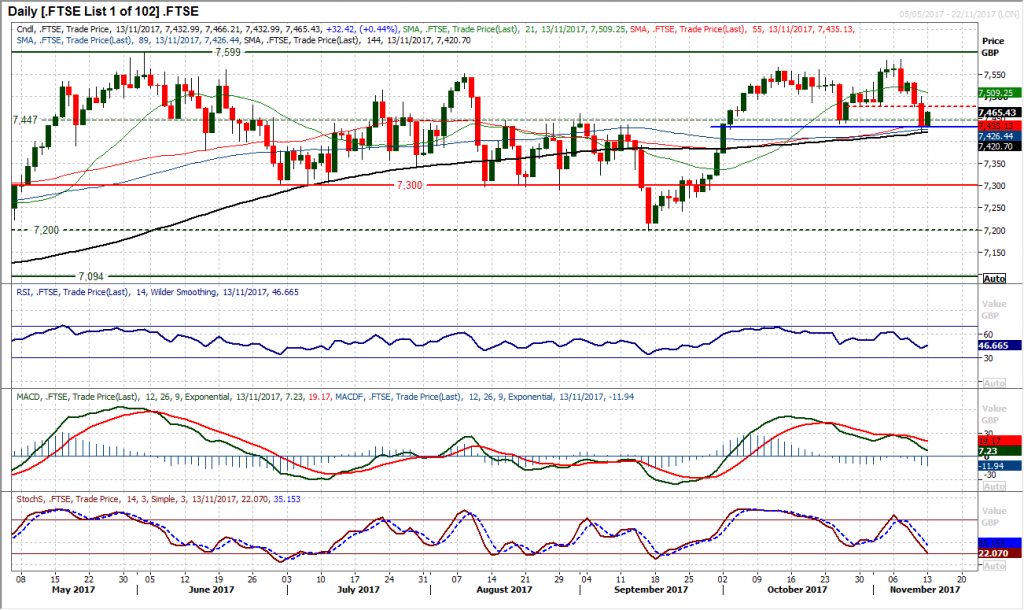
Just a handful of days after the market looked ready to test all-time highs the outlook has sharply deteriorated. Although not alone in its correction, the FTSE 100 technical outlook is by far the least positive of the major equity markets. FTSE has also closed below the support of a medium term pivot around 7450 within what is realistically a six month trading range but also the late October low of 7437. This move has completed a six week double top pattern and if confirmed by a second close below 7437, implies around 130 ticks of further correction now as the sellers mount. The concern is that if the momentum indicators now position negatively they would do so with downside potential too. The RSI confirms the top pattern and a move below 40 would be a key signal of negative pressure. The bear kiss on the MACD lines which are also accelerating lower is also a decisive signal. Rallies now become a chance to sell, with a resistance band 7437/7478 to be watched this knee jerk reaction bounce today.
EUR/USD
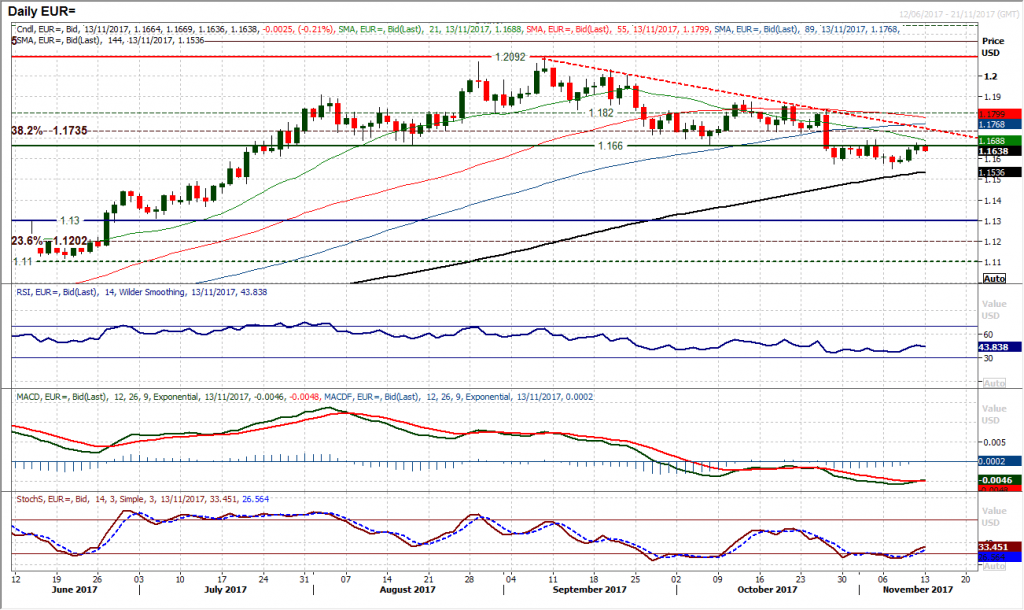
The rebound on the euro is once more back to trading around the neckline of the large top pattern around $1.1660. This marks the start of an area of overhead supply and a “sell zone” between $1.1660/$1.1730 that has restricted the bulls from gaining any real foothold in the market in the past couple of weeks. This still suggests that the near term rallies are a chance to sell. This comes as momentum indicators have started to tick higher on MACD and Stochastics, but the RSI has struggled as a moves to 50/55 have continually failed. I would be subsequently looking for the next selling opportunity. The hourly chart shows a more positive configuration on momentum but is the market already starting to roll over again this morning? Support is now at $1.1620 above $1.1575 and $1.1550. Friday’s high at $1.1678 is initial resistance.
GBP/USD
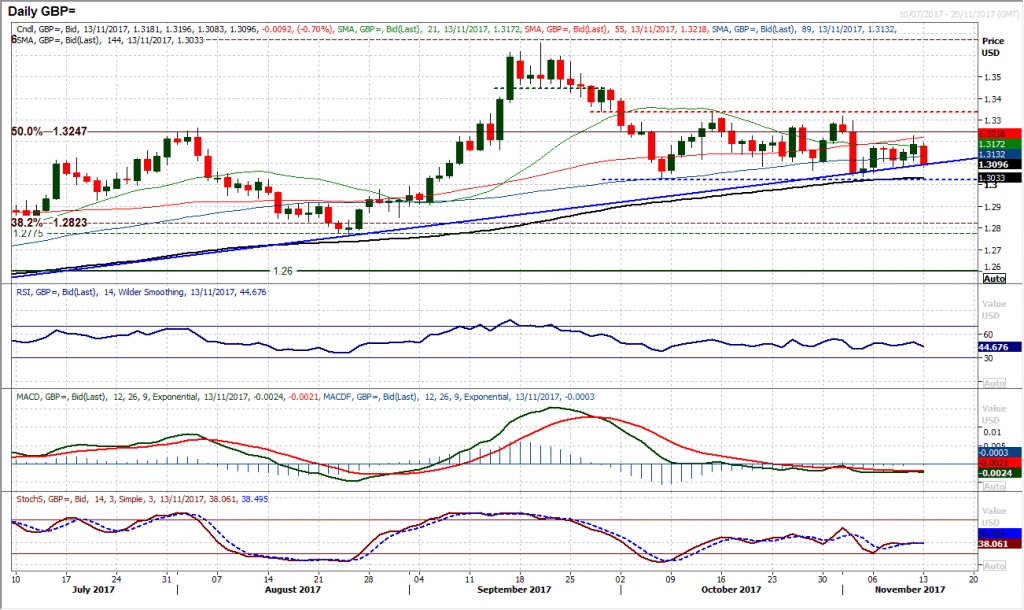
Sterling continues to throw off a number of mixed near term signals but taking a step back and the market is still holding on to the support of the long term uptrend and continues to trade within a five week consolidation range between $1.3025/$1.3335. The hourly chart reflects this range and it was interesting to see the near term pivot around $1.3230 once more providing a barrier. The fact that the market has subsequently dropped back again underlines the choppy nature of Cable. The perception of the politics of Brexit and stability of the UK Government are key factors for sterling and this is driving volatility on Cable and the market lower this morning. Until there is a closing breach of support at $1.3025 or resistance at $1.3335 there will continue to be a mixed near term outlook. However a breach of support at $1.3085 would increase the downside pressure as it would break the long term uptrend. The daily momenutm is not giving much but there is now a slight downside bias on the hourly as pressure has grown on the support. Resistance at $1.3230 is also growing now.
USD/JPY
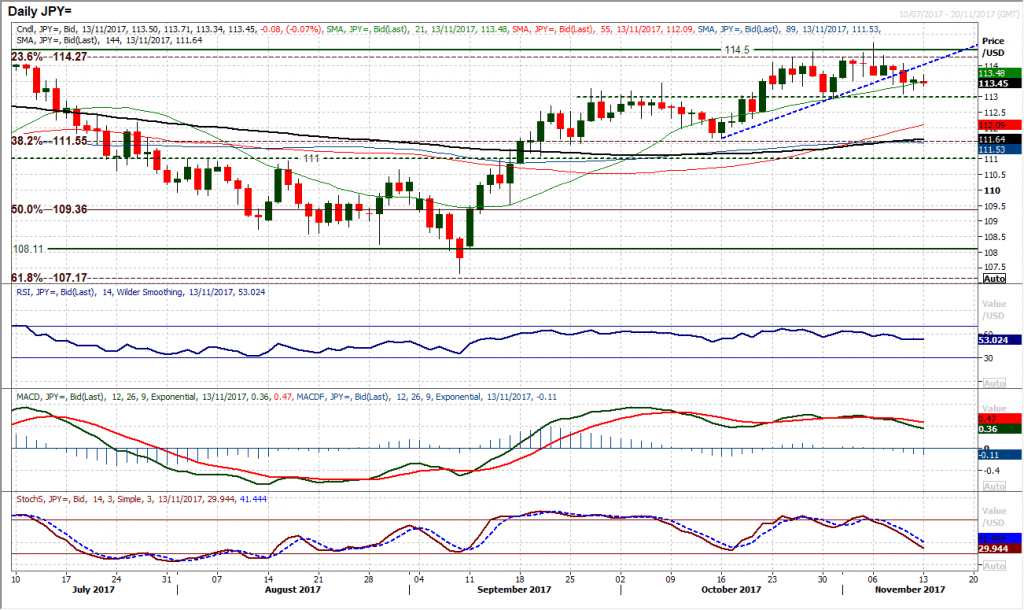
The near term outlook is beginning to turn more corrective as the three week uptrend has been broken and the daily momentum indicators continue to deteriorate. Downside traction is developing on MACD and Stochastics already and if the RSI drops below 50 it would be a nine week low and really suggest that the sellers are gaining the ascendency. The pressure is subsequently mounting on the key near term support at 112.95. However, for now the support remains intact. Friday’s small bodied (almost doji) candle has done little for direction but reflects the uncertainty in the market. There is a very mild negative bias near term with the early drop back today adding to this, resulting in a bias towards a test of 112.95. A closing breach of the support at 112.95 implies breakdown target of around 150 pips. Initial resistance is 113.70 and then 114.05, the latter of which needs to be breached to get the bulls back in control.
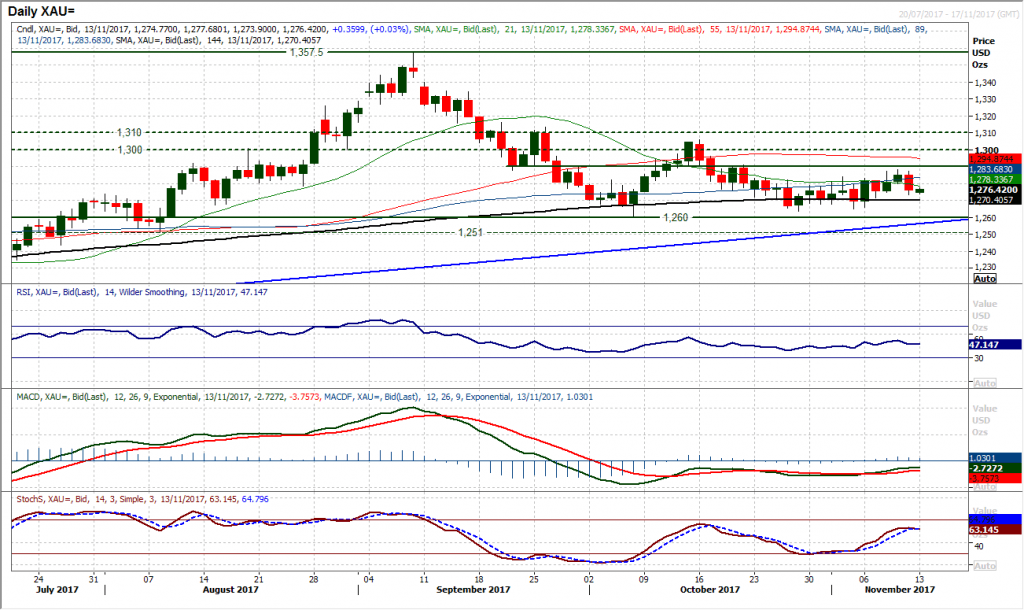
Gold
A sharp downside break into the close on Friday has once more added to the feeling that the bulls will continue to struggle in this market. Just as it looked that there was some upside traction developing the resistance kicked in and the market has fallen by the most in two weeks. The move has also negatively impacted on momentum with the RSI and Stochastics rolling over around levels where the sellers have been tempted back in again. The October sell signal on the Stochastics came around 70 and if the Stochastics again cross lower it would be another opportunity. Resistance is therefore growing now overhead with $1288 under the $1290/$1291 pivot range. The market has bounced a touch this morning but a failure on the hourly RSI under 60 and MACD lines around neutral would be a signal that the market is ready to drop back again. Initial support $1273.20 and $1271.60.
WTI Oil
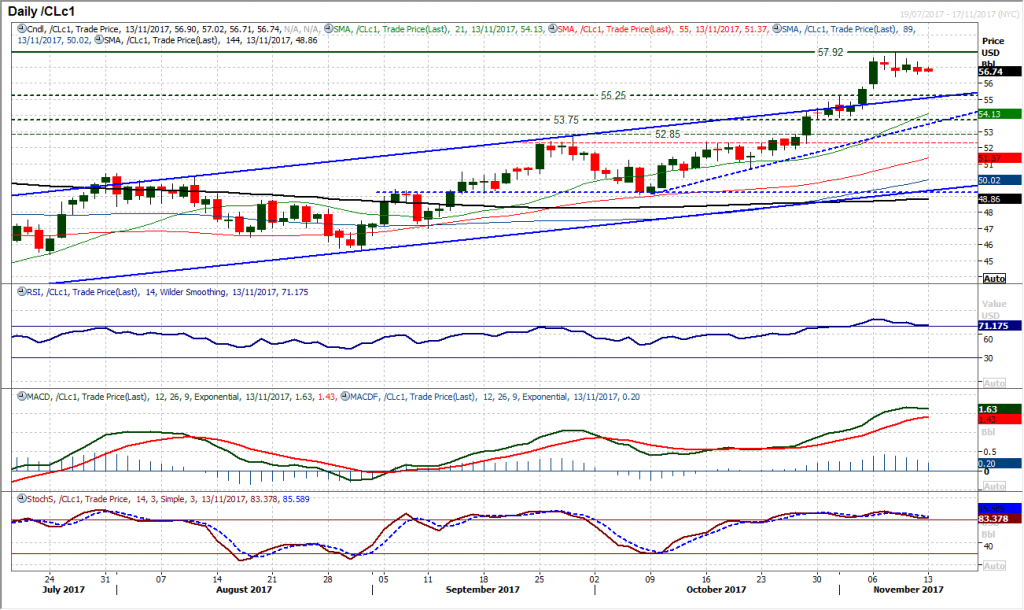
The WTI bulls have taken a step back as the trend higher has developed into a consolidation. However the legacy of Wednesday’s bearish key one day reversal remains on play whilst the resistance of what is now a two year high at $57.92 remains intact. Momentum indicators should continue to be watched on the daily chart with the RSI still hanging above 70 whilst the MACD lines and Stochastics remain positively configured. If these begin to dwindle then the threat of a correction will grow. Despite this, even if the price unwound back to the key breakout at $55.25 the outlook, the bulls would see this as a near term blip and a buying opportunity. Support is at $56.40.
Dow Jones Industrial Average
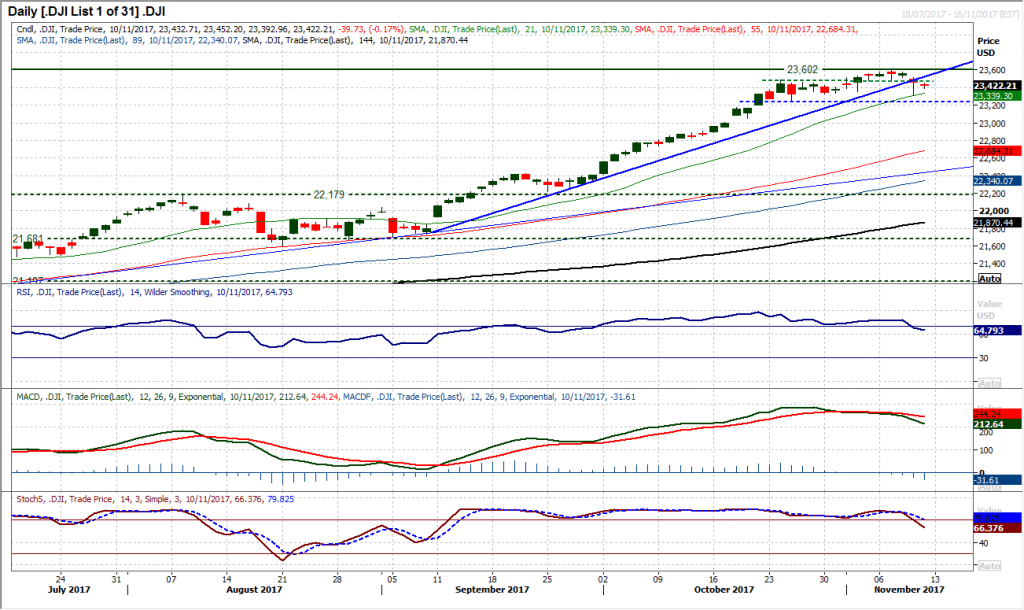
The outlook for the Dow is now beginning to deteriorate. Thursday’s intraday breach of the breakout support at 23,485 set up the market for further weakness on Friday and the sellers duly obliged with a session entirely below the old support. The support of the eight week uptrend has now been decisively broken by this move and a correction is building. The momentum indicators are now positing medium term corrective signals with the RSI closing decisively back below 70, the MACD lines accelerating lower following a bear cross and a confirmed sell signal on the Stochastics. The market is now open for a test of not only Thursday’s low of 23,310 but also the near term key reaction low at 23,250. If the latter support is broken then a new trend formation would begin. Resistance is now 23,485/23,517.
Author

Richard Perry
Independent Analyst


