Steeper it gets
S2N spotlight
Three days off the grid with family — time spent on spiritual growth and away from the noise of the news — was exactly what I needed. I promised myself that I would not mention the “T” word today.
The financial media has been tripping over itself coming up with superlatives to describe the bond market’s price action of late. I certainly think it is instructive given the trend for the market to gravitate towards safe havens when the stock market is collapsing.
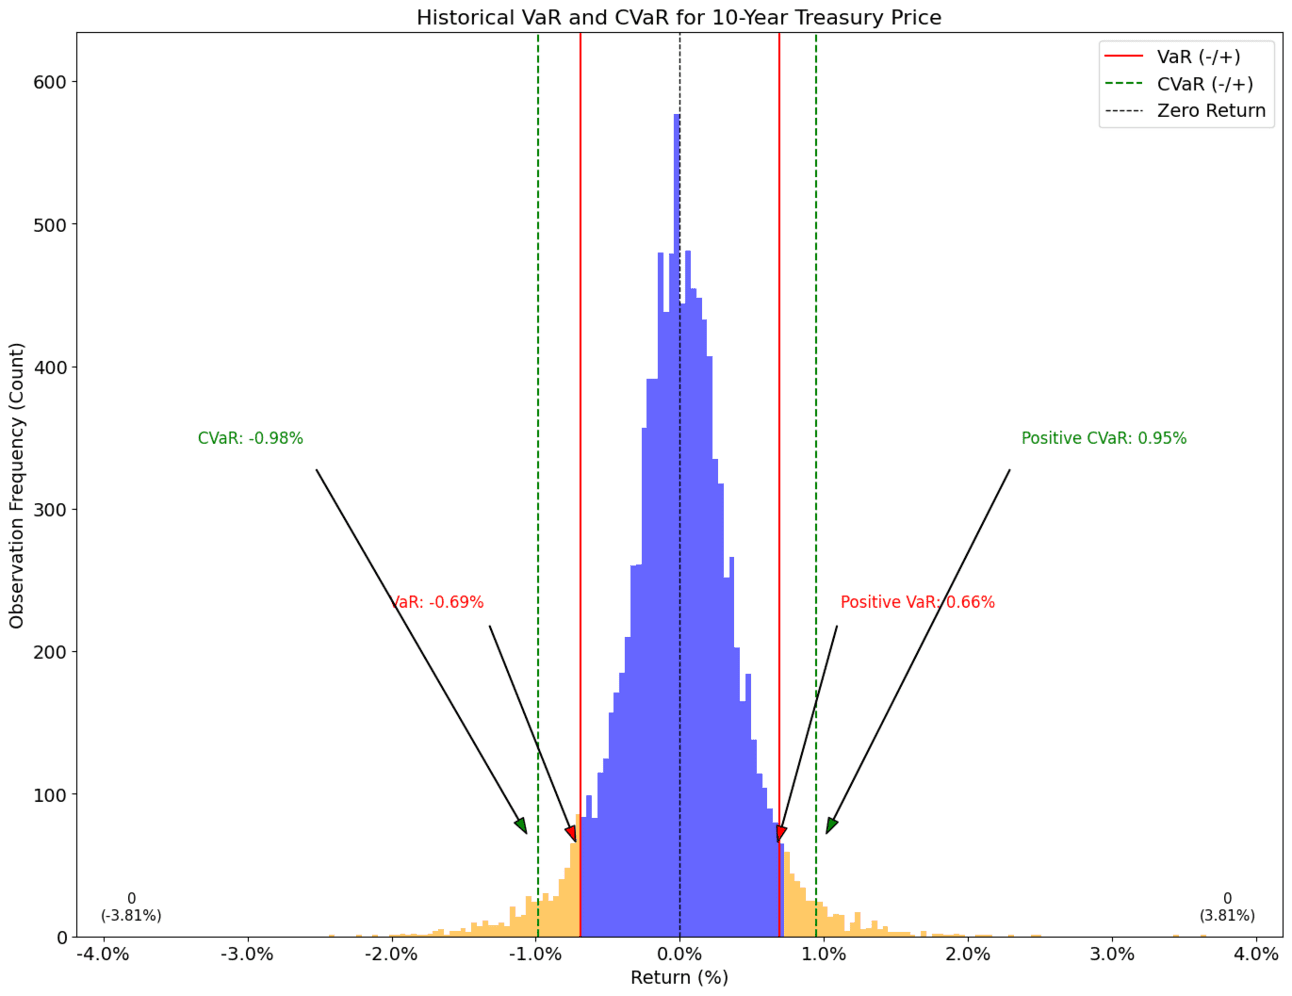
So I decided to investigate. When looking at the price action of the 10-Year Treasury over history, it certainly is quite extreme but nowhere near history’s extremes.

We are experiencing moves outside of the 95% VaR (value at risk) confidence level and the more extreme CVaR. CVaR is the average of all the returns that exceed VaR, so we are currently at the fat-tail end of the distribution.
I have written many times that the 2-year Treasury note is better than any Fed Chair. It continues to point towards lower Fed Fund Rates. So either the Fed will be lowering rates soon or the 2-year will need to trade higher. The gap between the 2 is still within normal range, so this gap could extend or persist for some time, therefore don’t expect an answer anytime soon.

Which brings me to a trade idea I made way back on the 17th of June 2024 in this letter. “I have been a believer in higher yields as inflation continues to be an issue that is not yet under control. I do, however, feel confident recommending a yield steepener trade. Buying the short end and shorting the long end, I think, is a pretty safe trade.”
I have included below the yield curve that I was seeing when I made the call. You can see the concavity of the purple line from 10 months ago. The natural order of bond yields is convexity, which means the further out in time, the higher yields should be to compensate for uncertainty.
The curve steepened a lot over the 10 months, as you can see with my arrows showing how the short end dropped. More recently the curve has caved in the middle, which brings me to the subject of today’s letter. I maintain that things are going to get steeper. The current shape of the yield curve provides more creative ways for structuring the trade.

S2N observations
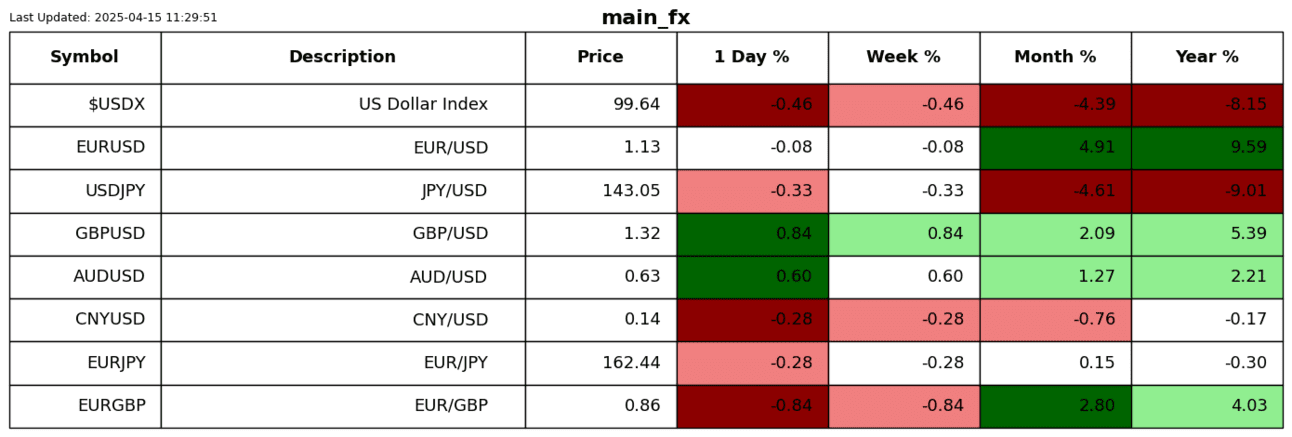
The US Dollar dropped below 100, which is a major psychological round number. I expected to see more discussion around this. I plotted a chart that goes back in history and shades the areas above and below 100. What is very interesting, at least to me, is that the US Dollar has spent more time below 100 against the basket of currencies the index is based off than above 100. So don’t slit your wrists if you think this is the end of the US.

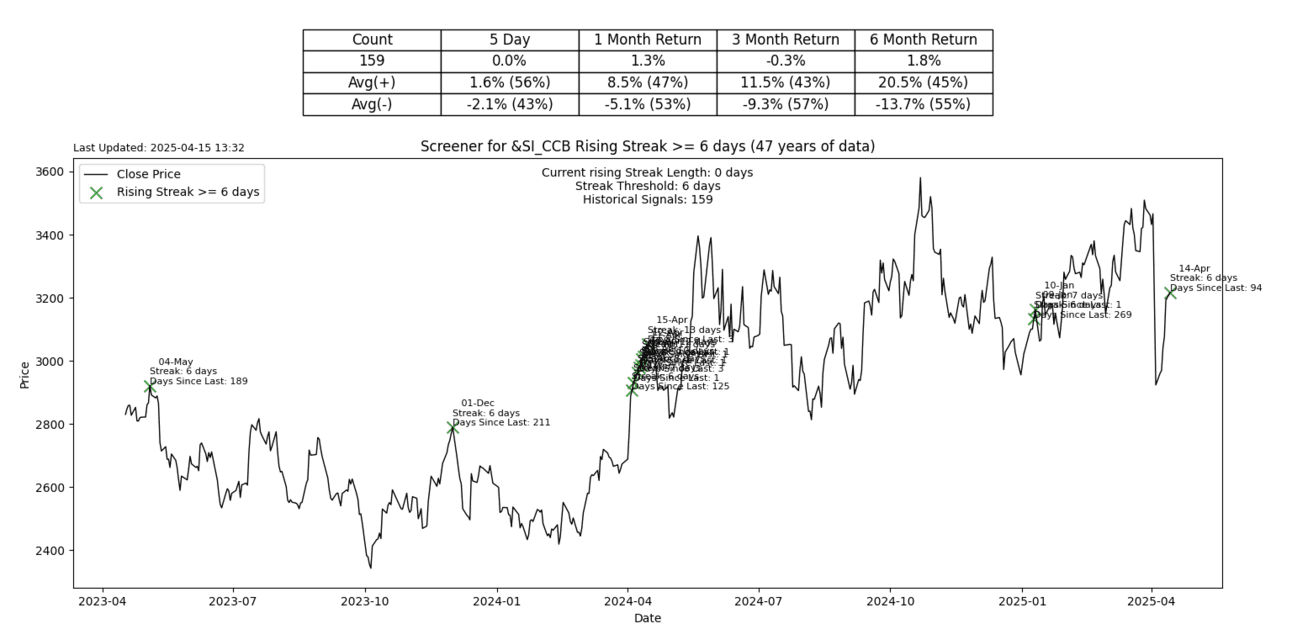
S2N screener alert
Silver rallied for its 6th day in a row.
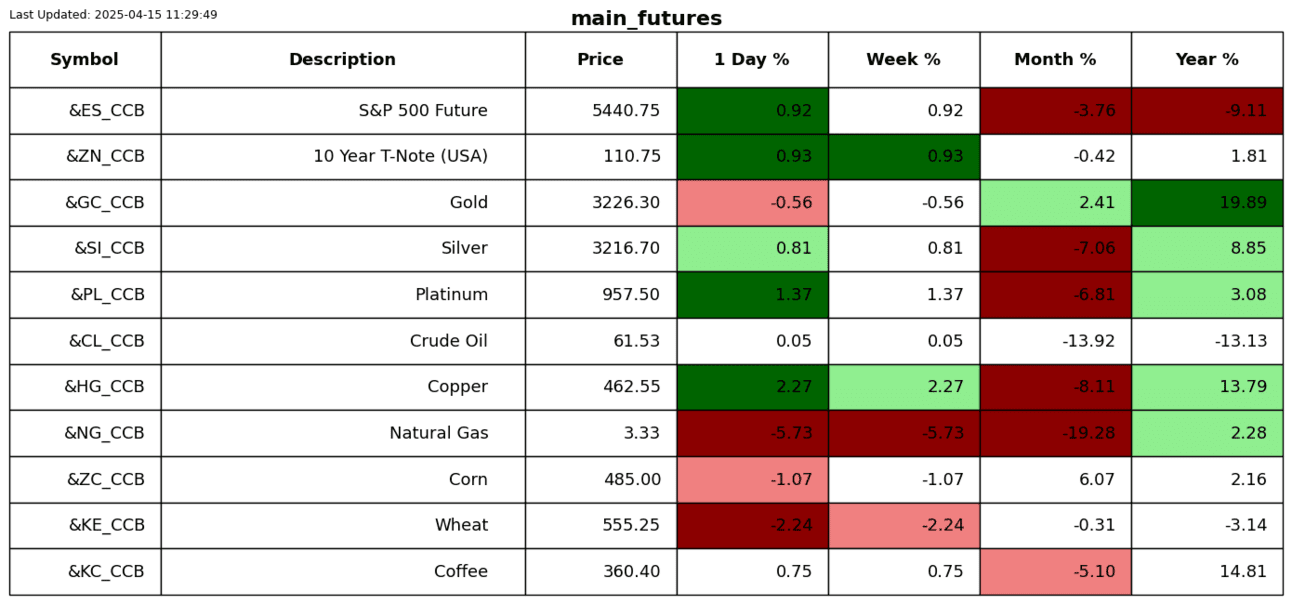
S2N performance review


S2N chart gallery


S2N news today
Author

Michael Berman, PhD
Signal2Noise (S2N) News
Michael has decades of experience as a professional trader, hedge fund manager and incubator of emerging traders.


