US Dollar: Mar. USD is Down at 89.955.

Energies: April '18 Crude is Up at 61.28.

Financials: The June 30 year bond is Up 11 ticks and trading at 145.05.

Indices: The June S&P 500 emini ES contract is 3 ticks Higher and trading at 2756.25.

Gold: The April gold contract is trading Up at 1319.00.  Gold is 12 ticks Higher than its close.

Initial Conclusion

This is not a correlated market.  The dollar is Down- and Crude is Up+ which is normal but the 30 year Bond is trading Higher.  The Financials should always correlate with the US dollar such that if the dollar is lower then bonds should follow and vice-versa. The S&P is Higher and Crude is trading Up+ which is not correlated. Gold is trading Up+ which is correlated with the US dollar trading Down-.   I tend to believe that Gold has an inverse relationship with the US Dollar as when the US Dollar is down, Gold tends to rise in value and vice-versa. Think of it as a seesaw, when one is up the other should be down. I point this out to you to make you aware that when we don't have a correlated market, it means something is wrong. As traders you need to be aware of this and proceed with your eyes wide open.

At this hour all of Asia is trading Lower.  At this time all of Europe is also trading Higher.

Possible Challenges To Traders Today

  • Building Permits are out at 8:30 AM EST.  This is major.

  • Housing Starts are out at 8:30 AM EST.  This is major.

  • Capacity Utilization Rate is out at 9:15 AM EST.  This is major.

  • Industrial Production is out at 9:15 AM EST.  This is major.

  • Prelim UoM Consumer Sentiment is out at 10 AM EST.  This is major.

  • Prelim UoM Inflation Expectations is out at 10 AM EST.  This is major.

  • JOLTS Job Openings is out at 10 AM EST.  This is major.
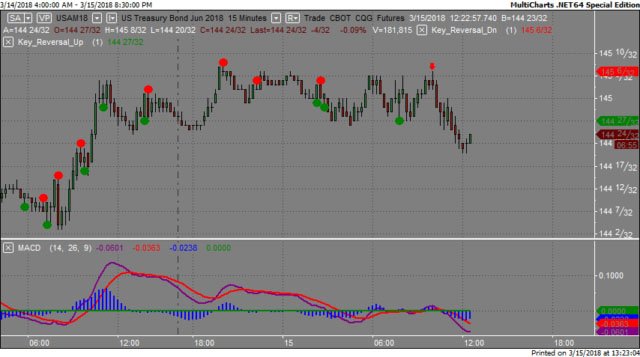
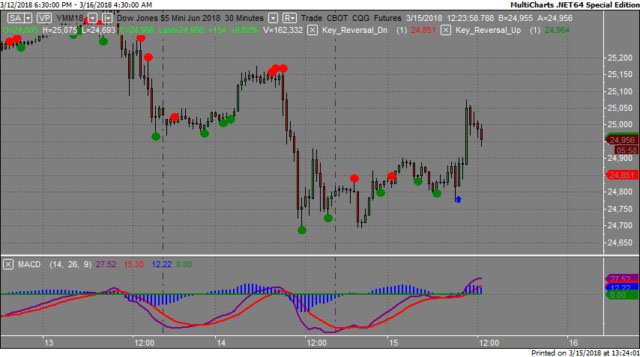
Treasuries

We've elected to switch gears a bit and show correlation between the 30 year bond (ZB) and The YM futures contract.  The YM contract is the DJIA and the purpose is to show reverse correlation between the two instruments.  Remember it's liken to a seesaw, when up goes up the other should go down and vice versa.

Yesterday the ZB made it's move at around 10 AM.  The ZB hit a High at around that time and the YM hit a Low.  If you look at the charts below ZB gave a signal at around 10 AM EST and the YM was moving Higher at the same time. Look at the charts below and you'll see a pattern for both assets. ZB hit a High at around 10 AM and the YM hit a Low.  These charts represent the newest version of MultiCharts and I've changed the timeframe to a 30 minute chart to display better.  This represented a Shorting opportunity on the 30 year bond, as a trader you could have netted about 15 plus ticks per contract on this trade.  Each tick is worth $31.25.

Charts Courtesy of MultiCharts built on an AMP platform.

ZB

YM

Bias

Yesterday we gave the markets a Neutral bias as all instruments were pointed higher and this included the indices themselves.  The Dow gained 116 points but the other indices closed lower.  Today we aren't dealing with a correlated market and our bias is to the Downside.

Could this change? Of Course.  Remember anything can happen in a volatile market. 

Commentary

Yesterday we gave the markets a Neutral bias as all the instruments we track for Market Correlation purposes were pointed Higher except Gold which was down fractionally yesterday morning.  A Neutral bias means the markets can go in any direction and often does.  The Dow gained 116 points but the other indices lost ground.  Today we have 7 economic reports, all of which are major and proven market movers.  Building Permits, Housing Starts are all real estate related and this will tie in neatly with what the Fed may do next week at the FOMC Meeting to be held on March 21st.

Trading performance displayed herein is hypothetical. The following Commodity Futures Trading Commission (CFTC) disclaimer should be noted.

Hypothetical performance results have many inherent limitations, some of which are described below. No representation is being made that any account will or is likely to achieve profits or losses similar to those shown.

In fact, there are frequently sharp differences between hypothetical performance results and the actual results subsequently achieved by any particular trading program. One of the limitations of hypothetical performance trading results is that they are generally prepared with the benefit of hindsight.

In addition, hypothetical trading does not involve financial risk, and no hypothetical trading record can completely account for the impact of financial risk in actual trading. For example, the ability to withstand losses or to adhere to a particular trading program in spite of trading losses are material points which can also adversely affect actual trading results.

There are numerous other factors related to the markets in general or to the implementation of any specific trading program which cannot be fully accounted for in the preparation of hypothetical performance results and all of which can adversely affect actual trading results.

Trading in the commodities markets involves substantial risk and YOU CAN LOSE A LOT OF MONEY, and thus is not appropriate for everyone. You should carefully consider your financial condition before trading in these markets, and only risk capital should be used.

In addition, these markets are often liquid, making it difficult to execute orders at desired prices. Also, during periods of extreme volatility, trading in these markets may be halted due to so-called “circuit breakers” put in place by the CME to alleviate such volatility. In the event of a trading halt, it may be difficult or impossible to exit a losing position.

Recommended Content


Recommended Content

Editors’ Picks

EUR/USD fluctuates near 1.0700 after US data

EUR/USD fluctuates near 1.0700 after US data

EUR/USD stays in a consolidation phase at around 1.0700 in the American session on Wednesday. The data from the US showed a strong increase in Durable Goods Orders, supporting the USD and making it difficult for the pair to gain traction.

EUR/USD News

USD/JPY refreshes 34-year high, attacks 155.00 as intervention risks loom

USD/JPY refreshes 34-year high, attacks 155.00 as intervention risks loom

USD/JPY is renewing a multi-decade high, closing in on 155.00. Traders turn cautious on heightened risks of Japan's FX intervention. Broad US Dollar rebound aids the upside in the major. US Durable Goods data are next on tap. 

USD/JPY News

Gold keeps consolidating ahead of US first-tier figures

Gold keeps consolidating ahead of US first-tier figures

Gold finds it difficult to stage a rebound midweek following Monday's sharp decline but manages to hold above $2,300. The benchmark 10-year US Treasury bond yield stays in the green above 4.6% after US data, not allowing the pair to turn north.

Gold News

Worldcoin looks set for comeback despite Nvidia’s 22% crash Premium

Worldcoin looks set for comeback despite Nvidia’s 22% crash

Worldcoin price is in a better position than last week's and shows signs of a potential comeback. This development occurs amid the sharp decline in the valuation of the popular GPU manufacturer Nvidia.

Read more

Three fundamentals for the week: US GDP, BoJ and the Fed's favorite inflation gauge stand out Premium

Three fundamentals for the week: US GDP, BoJ and the Fed's favorite inflation gauge stand out

While it is hard to predict when geopolitical news erupts, the level of tension is lower – allowing for key data to have its say. This week's US figures are set to shape the Federal Reserve's decision next week – and the Bank of Japan may struggle to halt the Yen's deterioration. 

Read more

Majors

Cryptocurrencies

Signatures