SP500 Volatility Ahead

SP500
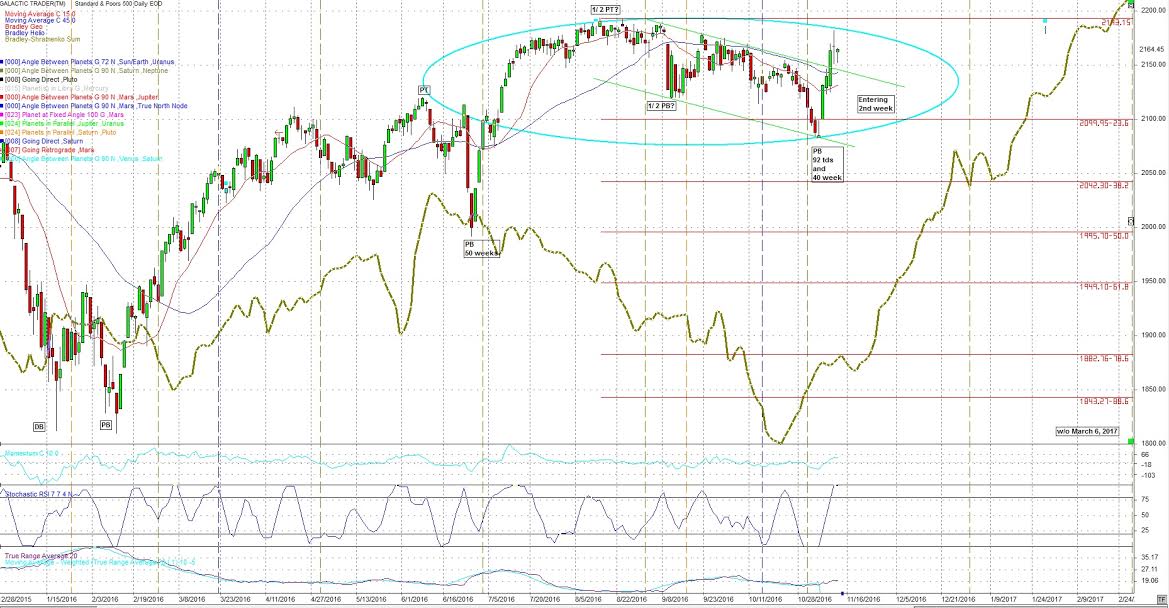
For the SP500, cycle-wise November 4th looks like the Primary cycle trough. 1 which puts us entering the 2nd week of a new nominal 18 week cycle. This is quite probably the 40 week cycle trough as well.
The next estimated Primary cycle ( aka nominal 18 week cycle) low is estimated to be March 6th +- 3 weeks with a range of February 13th, 2017 to March 19, 2017. It could also be the week of March 19, 2017 +- 3 weeks. As we get closer I use the upcoming Astros to try and get a more exact reading on when the Primary cycle trough will occur.
We still have a number of Neptune transits this month. I still expect general confusion into early December.
There is another date near the end of the month which could indicate a pleasant change. If not pleasant it should at least be a change.
For those who have been reading this blog for awhile I've been looking for some large deceit or lies being exposed. The whole mess of the scandals in the US election was probably it and includes WikiLeaks and Anonymous.
The internet outage on October 21 is certainly an indication of how secure the internet is and how vulnerable to attack. As someone said "Build a FireWall before a Wall." It also shows the power and influence of some of these information based organizations like Anonymous and WikiLeaks.
In addition there is a 12 year aspect hitting near the end of the month. This synodic cycle relates to the growth of international terrorism and political power. It also has evidence of an impact on the economy. In brief, the attainment of power of all kinds.
We saw a number of earthquakes over 6.0 in October. With a number of Neptune transits in November we may be seeing more. Look for more geophysical activity closer to November 14, a perigee Full Moon or SuperMoon which means the Moon is very close to the closets point to Earth for this Lunar orbit. This puts extra gravitational forces at work. It can be seen in increased tidal strength and has a history of increased earthquake activity and violent weather. Violent people as well. This Super Moon is one of the strongest in many years. As I write this blog I noticed Japan had a 6.2 earthquake today, November 11, 2016.
Following is a daily chart of the SP500. The brown line is an adjusted Bradley indicator. It's purpose is to find a change in trend. This is not straight forward to read and the details with video are in section 9 of the subscribers report.
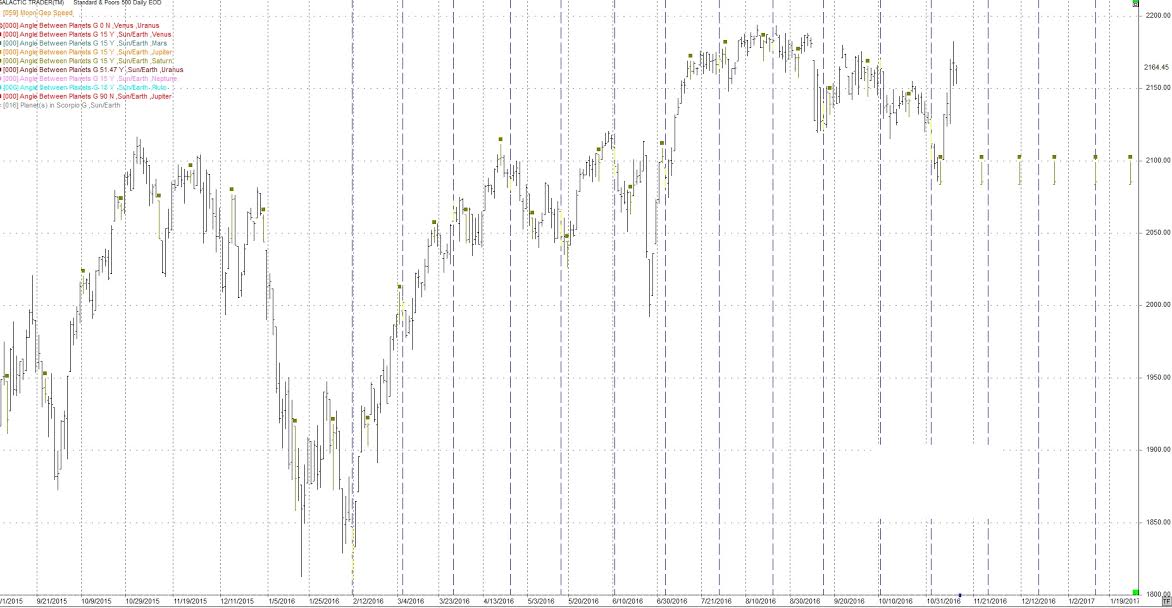
Following is our normal daily chart for the SP500. Price is now above both the 15 and 45 day sma's. The 15 day is still below the 45 day but gaining. They both turned up. A usual setup leading out of a Primary cycle low.
Video
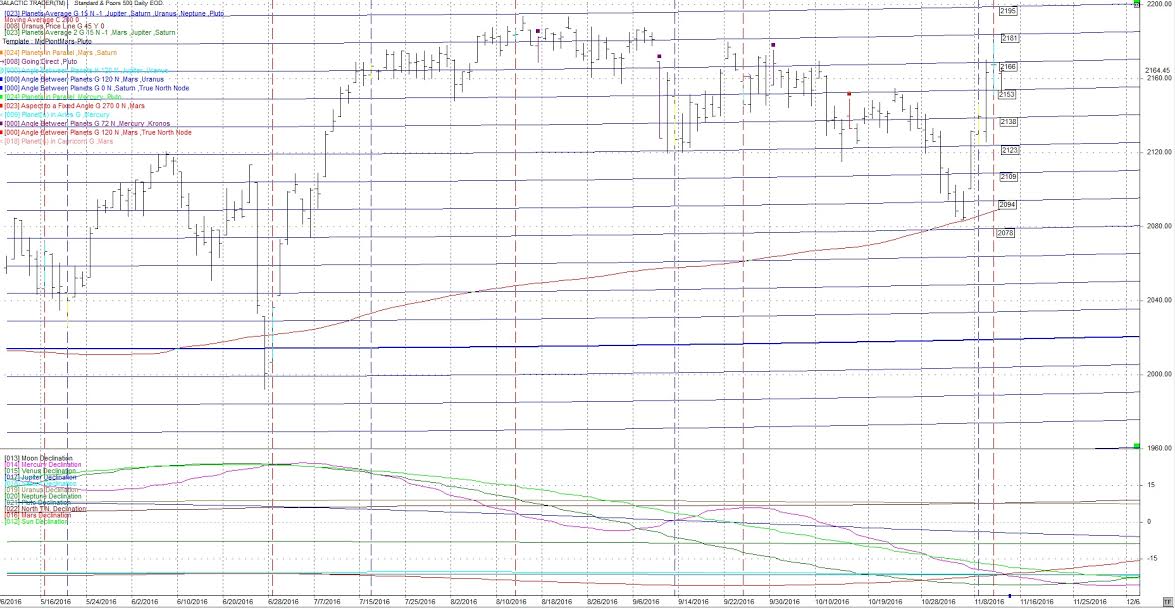
Following is a chart of the planetary average longitude. The horizontal blue lines are based on the average longitude of the planets Jupiter, Saturn, Uranus, Neptune and Pluto which are converted to price. The levels this calculates typically are excellent points to place sell or buy stops. I often use them with Fibonacci retracement levels as well. Price ended at 2,164.45 very close to the 2,166 planetary average.
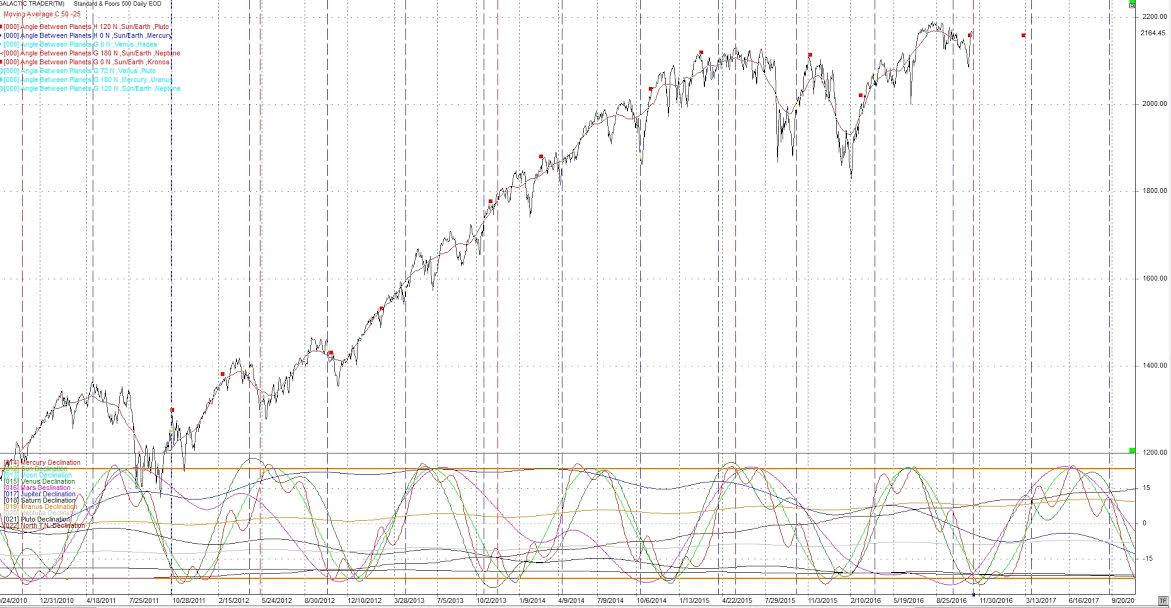
There is another longer term cycle hitting next week, the 377 trading day cycle. I believe I got this cycle from Stan Harley some time ago. Being longer term it' needs a wide orb +- 1 or 2 weeks. The November 4th low could have been it or it is directly ahead. Note it has been at highs and lows. See the red vertical lines on the following chart. I bring this up only to warn of the possibility. This cycle often appears when Venus is Out of Bounds in either north or south declination. Venus is Out of Bounds now.
Harmonics
I continue to watch the 24th harmonic cycle (360 / 24) cycle between the Sun and Saturn, which are the brown squares on the following daily chart. The last hit was
November 4th, the day of the cycle troughs we have been following. The next hits are then Nov. 23rd and Dec. 9th. They are often at short changes in trend.
Rumors from the FED that Yellen wants a "high-pressure economy" meaning increased inflation with no rate cuts. There were also rumors of the FED buying stock directly. They should review Japan again.
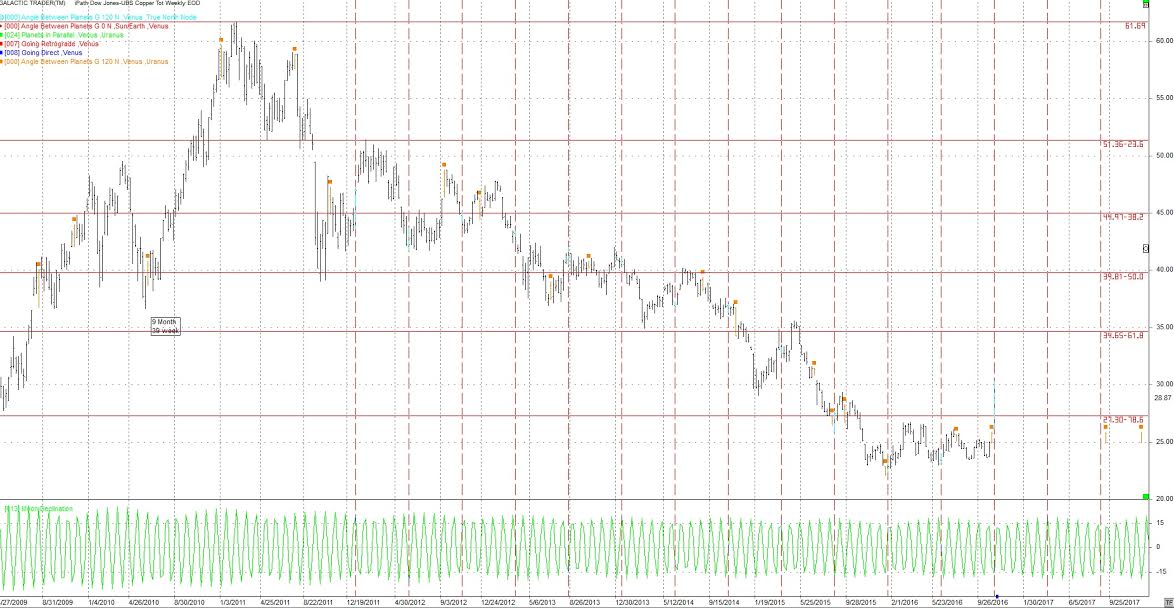
A note on Copper which we do not usually cover on the blog. On November 5, Venus, the ruler of copper was trine Uranus. On November 6, Venus was trine Eros. On November 7 Venus is quintile Jupiter and November 9, Venus is quintile Neptune. The following weekly chart shows the Venus trine Uranus (orange squares) and the 21 week cycle (red vertical lines). Both the 21 week cycle and Venus trine Uranus have been close to change in trend for copper.
”Behind the wall, the Gods play with numbers"
-- Le Corbusier
Author

TradingDaze
Aisys Technologies Inc.
Gordon Lawson, aka TradingDaze, is a Canadian CPA, certified computer programmer and Astrologer. My traditional career spanned 25 years as a Financial Analyst at Suncor and Manager of Information Systems at BP Resources Canada. After this time Mr.