SP500 "Should be Volatile

We have finally seen the move down we were waiting for.
Following are the dates from a post 2 weeks ago.
Sept 30 Pluto Direct (often reversals in US markets)
Oct 2 Mercury square Pluto enhancing the Pluto Direct aspect.
Oct 3 Mars Parallel Pluto also enhancing the Pluto Direct aspect.
Oct 5 Venus Retrograde and
Venus parallel Mars
Oct 10 Venus squared Mars
Oct 10 Hades Retrograde ( may involve Canada over a period of time, difficulties
Oct 11 Mercury enters heliocentric Sagittarius (often a move in Gold)
As usual dates are a minimum +- 3 tds. On longer timed aspects a time frame will be included.
On Sept 30 Pluto turned Direct. Before Pluto turns Direct it will trine the Sun approx..19 days before the Direct date. In this case on Sept 11.
After Pluto turns Direct the Sun will square Pluto approx. 12 days after the Pluto Direct date. In this case on Oct 12th which is 1 day off the largest part of the move down.
The move down is going into the Primary Cycle (18 week) low and may also be a 2 year cycle low, identified by someone else.
SP500
The last Primary cycle trough was June 28, 2018. We are now about to enter the 16th week of the current Primary Cycle. The 18th week of the Primary cycle is the week of October 29.
Price is below the 15 day sma and the 45 day sma and the 15 day sma is above the 45 day sma. Both averages are curled over. Today Oct 12 the SP500 is bouncing up. This may continue Monday but we are still in the range where there may be a further move down. I would like to see the 15 day sma move lower then the 45 day sma. Bear in mind the start of a bear market is possible.
The following dates may have significant moves or start a move.
Nov 6 North Node enters Cancer
Nov 6 Uranus squares the North Node and enters Aries (backwards, it’s retrograde)
Nov 6 Sun trine Neptune
Nov 7 Jupiter trine the North Node
Nov 6 are the USA mid-term elections. We should be aware of actions by either political party which could affect the markets.
The following daily chart shows the SP500 is above the January 2018 highs.

The following daily chart of the SP500 is what we have been showing under the 24 Harmonic chart. Look at the area in the red circle. This is the basis of what we have been forecasting on.
Following is the 24 Harmonic chart we have shown for many months.
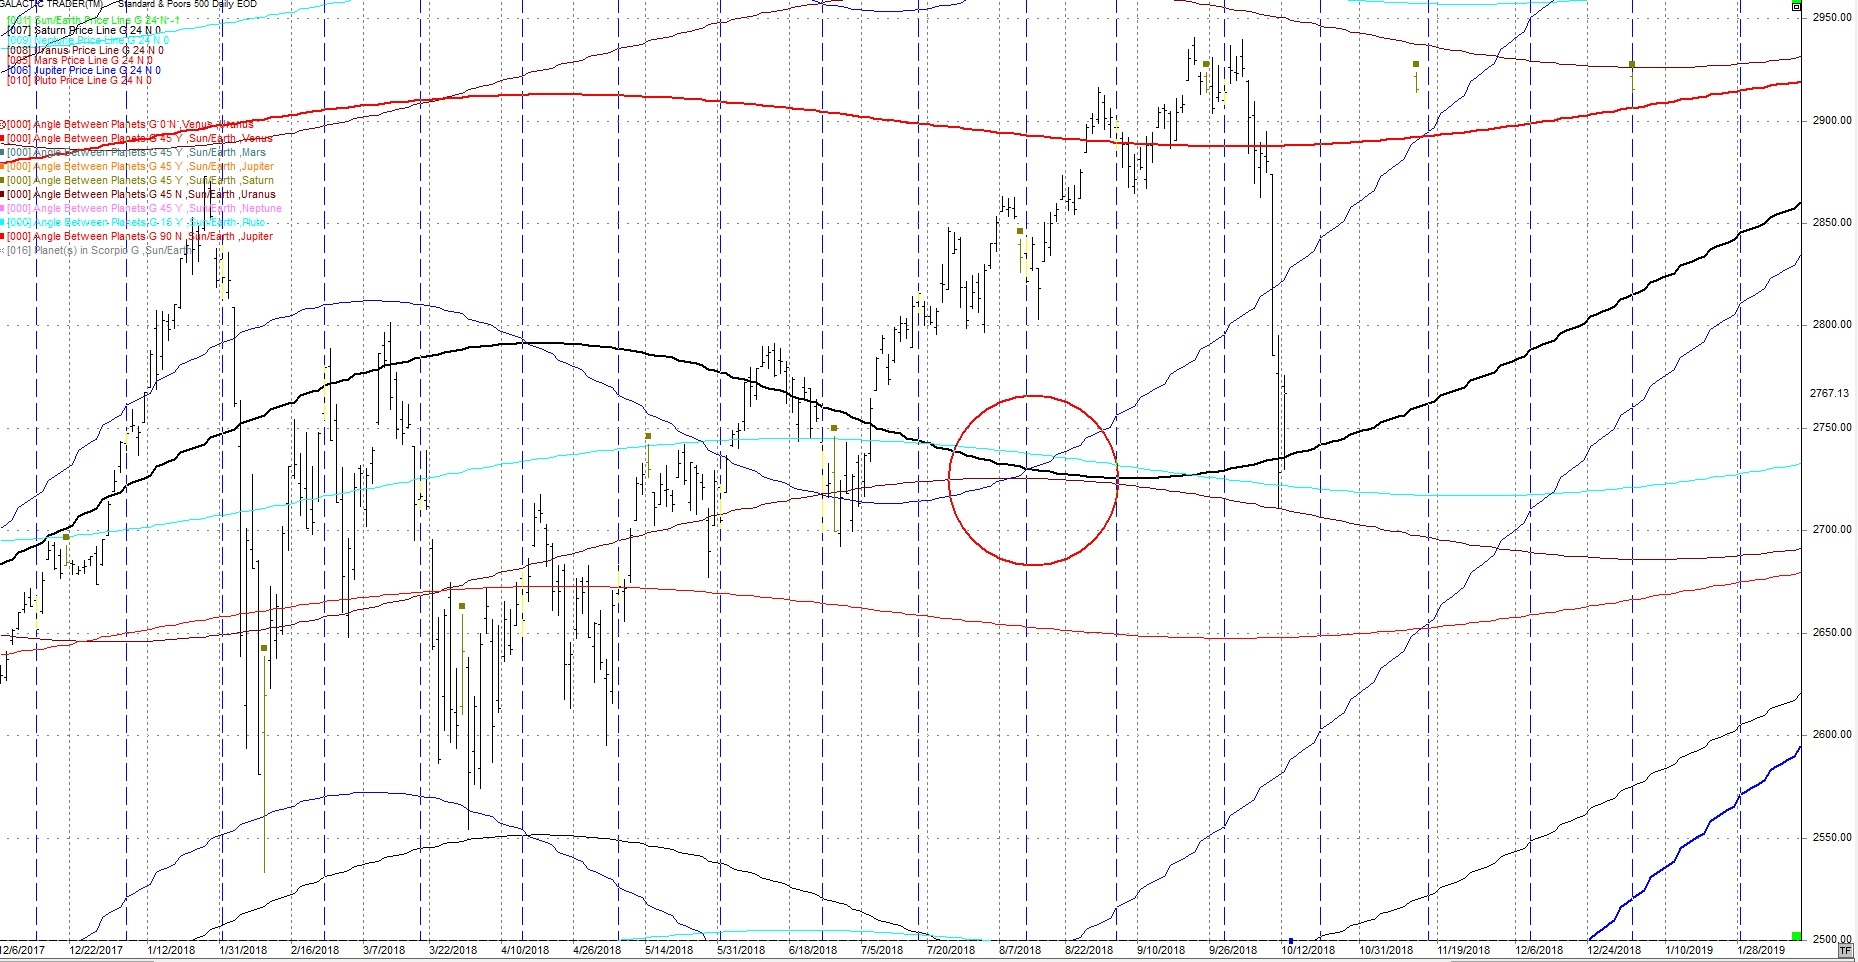
The next hits are Nov 13, 2018 and Jan. 2, 2019. The latter number is on the Uranus price line. Watch closely.
Both could be big moves or big range days.
Also hitting at this time is a 162 week cycle which is close to 3 years. For you Tesla fans
162 = ( 3 * 6 * 9 ). This hit a couple of weeks early.

The 9 month cycle

The above chart shows the 9 month or 39 week cycle (blue vertical lines). It was due and appears to have formed in late January. The 20 week cycle was added as well (red vertical lines). Any green lines are a combination of the 20 and 40 week cycles. The 20 week cycle was only 1 day away from the sharp move down.
From the last few posts:
“This coming year could see an increase in geophysical activity, both earthquakes and volcanos.”
See the link under “Earthquakes”. This is an application from the USGS.
There has been a number of volcano’s erupting as well. Japan and Hawaii.
On a longer term basis the following monthly chart of the DJIA shows the 15 year cycle (red vertical lines) and the 45 year cycle (blue lines). The 15 year is due now or took place April – June 2018. The 45 year due in Sept 2019. This is another example of a longer-term cycle possibly distorting shorter term cycles. Bear in mind they need a broad orb.
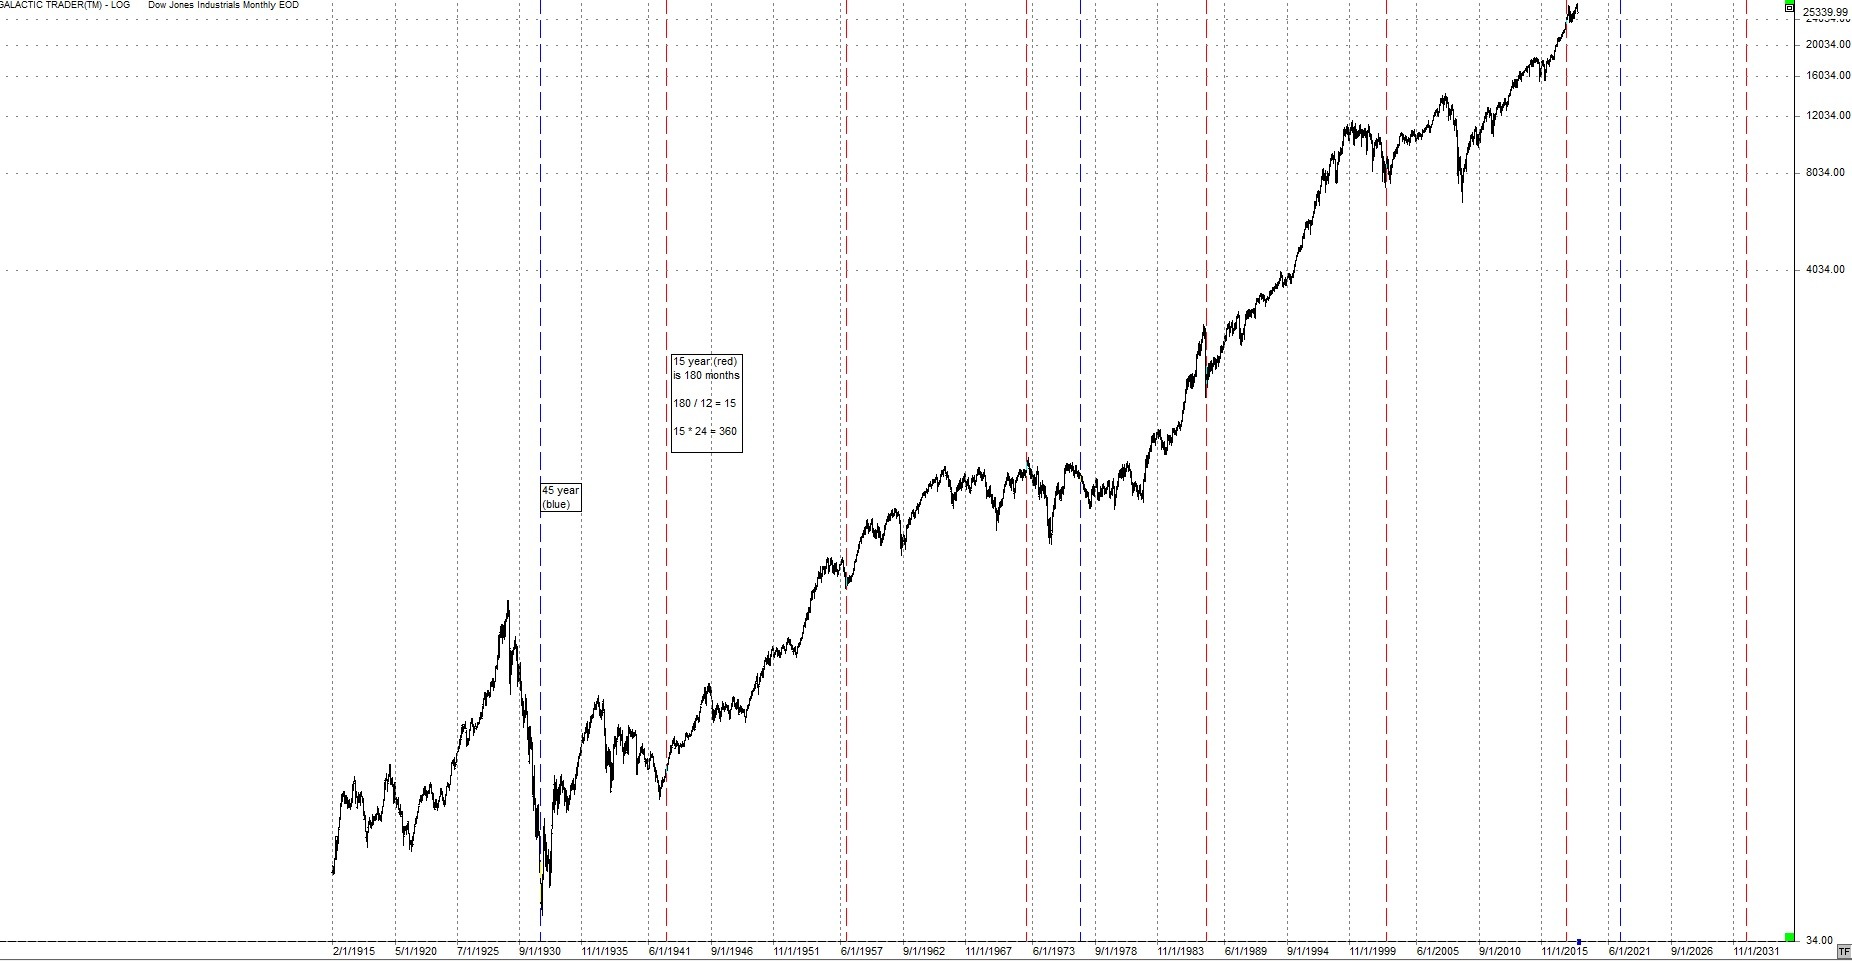
Regarding a note from a reader the 45 year cycle is the ½ cycle to the 90 year cycle. It is the vertical blue lines.
The following daily chart of the SP500 shows 2 Envelope channels. Red is the centered
20 week envelope channel. Blue is the centered 40 week envelope channel. The dark blue squares are the Sun / Neptune square which is often a short term change in trend.
We have had this noted it was due for a sell. Also note the dark blue squares. They are the dates of the Mars square Uranus transit.

We are entering the difficult time mentioned over the last few months.
The envelope channel charts are easy to calculate. In the above case the blue lines are based on a 40 day average but when they are plotted they are centered. For a 40 day it will be shifted by 20 days which is the ½ cycle.
The red averages are based on the 20 week so they are shifted 10 weeks or a ½ cycle.
I brought up Iran on the last post. I’ll come back to those charts on any potential signs of conflict.
Author

TradingDaze
Aisys Technologies Inc.
Gordon Lawson, aka TradingDaze, is a Canadian CPA, certified computer programmer and Astrologer. My traditional career spanned 25 years as a Financial Analyst at Suncor and Manager of Information Systems at BP Resources Canada. After this time Mr.


