'SP500 ' seems suitable

The next 1/2 year Forecast Dates are available for purchase
(January, 1 2017 - June 30, 2017)
Subscribers receive 6 months forecast no matter when they sign up.
and a monthly Market letter with
- We do not use negative option billing nor do we sell email addresses
SP500
For the SP500, cycle-wise November 4th was the Primary cycle trough. 1 which puts us entering the 7th week of a new nominal 18 week cycle. This was the 40 week cycle trough as well.
It should be noted Primary cycles (18 weeks) most often start with a 6 week sub-cycle. We are there. The 2nd most common start is a 1/2 Primary or 9 week sub-cycles.
The next estimated Primary cycle ( aka nominal 18 week cycle) low is estimated to be March 6th +- 3 weeks with a range of February 13th, 2017 to March 19, 2017. It could also be the week of March 19, 2017 +- 3 weeks. As we get closer I will use the upcoming Astros to try and get a more exact reading on when the Primary cycle trough will occur. Early April is another possibility.
Last month had a number of Neptune transits. The second half of December has a number Uranus transits. These start on Monday December 12 when the Sun trines Uranus. Uranus is in fiery Aries. This is always approx. 17 cd's (calendar days) before the Uranus Direct signature and 12 cd's after Uranus Direct is the Sun square Uranus on January 10, 2017. This is a Uranian time between Dec 12 and Jan 10th. Uranus can indicate the outbreak of political tension, rioting, right-wing political ideas, free market enterprises, airplanes, breakthroughs, surprise discoveries, explosions, demonstrations, retaliation, advanced technologies and surprises in many areas of life.
Last week we had the FOMC meeting and finally a rate increase even though bonds have already moved. Remember, QE was to bale out the banks, not the economy. They also suggested they could be looking at 3 rate increases next year, instead of 2. An increasing US$ will make US exports more expensive in other countries and increasing the trillions in US denominated debt will make the debt more expensive to pay back. In additions commodities don't do well in a rising interest rate environment.
December 19 starts the Mercury Retrograde period. Covered many times, Mercury is known as the trickster and the retrograde period is not a good time to make decisions, or sign contracts or agreements. It's about confusion, mis-directed energy and troubled communications including; speaking, writing and transmitting. Something may be put on hold. Go ahead and plan. Mercury has it's most effect on people who know nothing about it. This Mercury retrograde will start when Mercury is close to a conjunction with Pluto, suggesting a major agreement of some kind. Note, Mercury gets close to Pluto but turns retrograde before it is in exact conjunction. The Mercury Retrograde period will last until Mercury turns Direct on January 8, 2017.
We have had an amazing rise since the US election but now coming into a period of Astrological aspects which have a history of turns. Coming up we have Mercury Retrograde, Saturn trine Uranus, Jupiter opposition Uranus and Uranus Direct. On January 1st Mars conjunct Neptune which could be pointing to a possible violent event. More on these aspects were sent to subscribers.
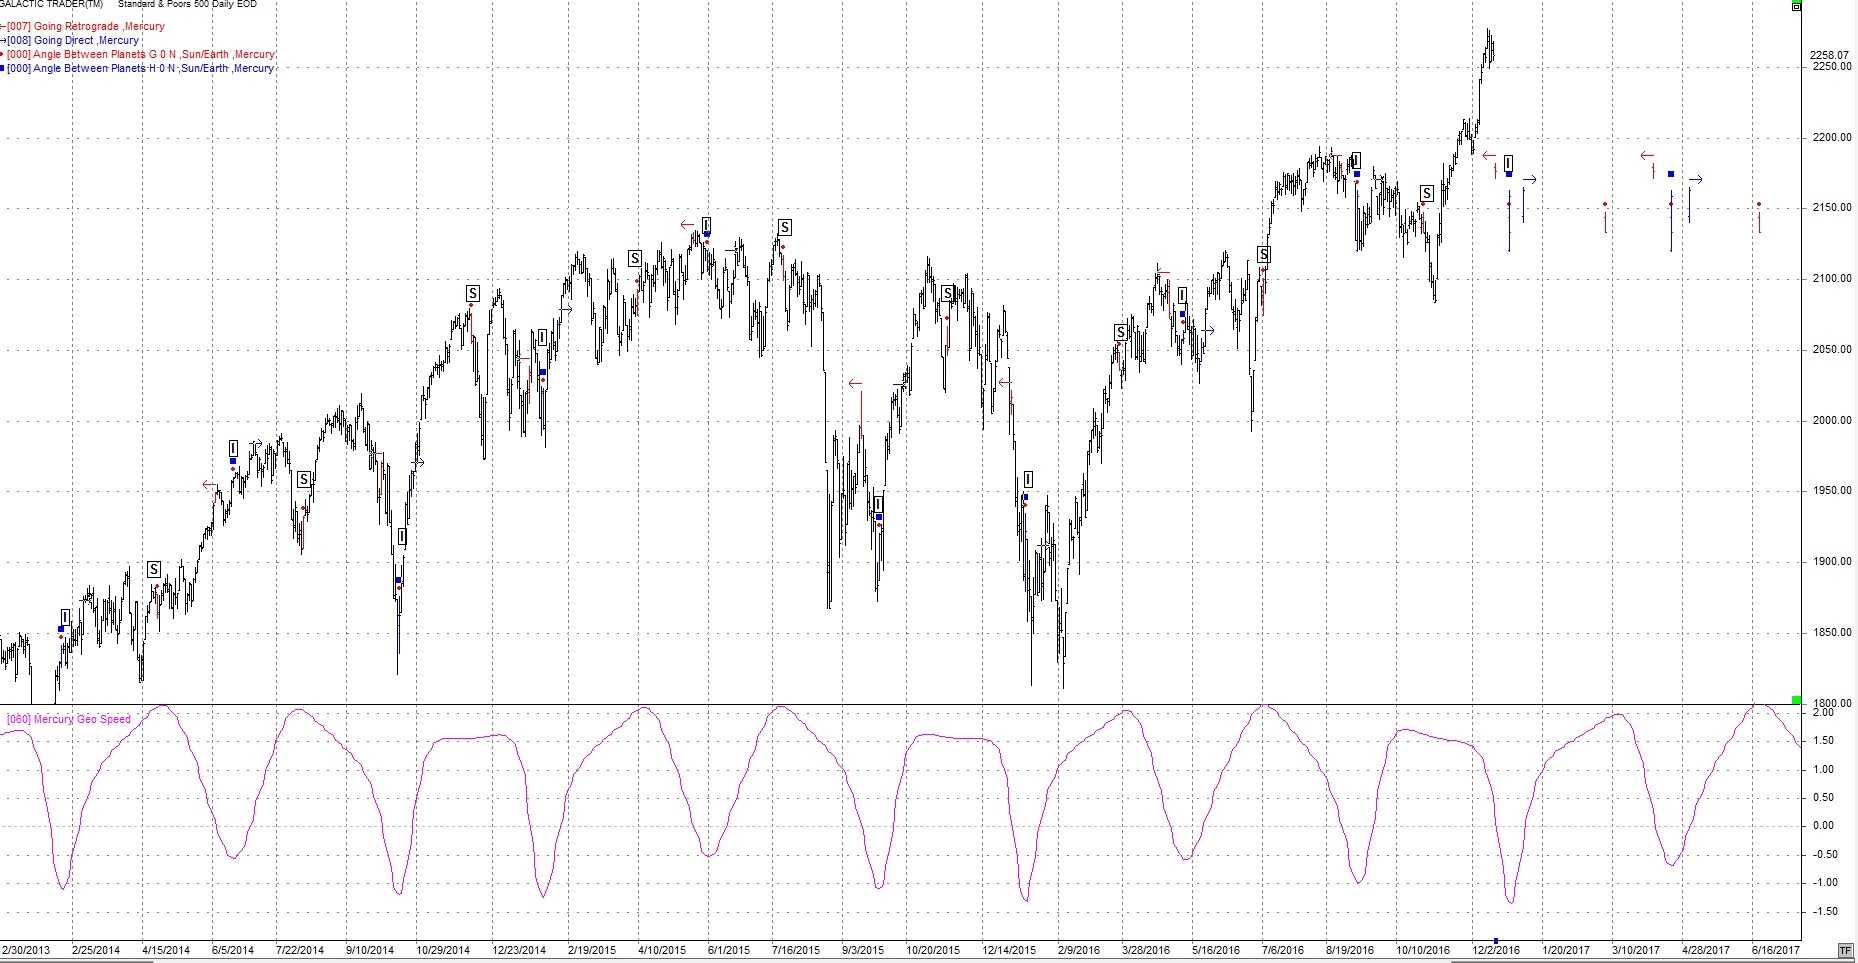
Following is a daily chart of the SP500 with the Mercury retrograde (red arrow pointed left) and Mercury direct (blue arrow pointed right). This chart also shows the Superior and Inferior conjunctions.
December 26 when the US markets are closed for Christmas there is a 14 year aspect, Jupiter opposing Uranus. This is the first of a 3-pass with 2 oppositions in 2017. At times this opposition will be a T-square with Pluto at the Apex. The French Astrologer, Barbault considers this transit to be predominantly a capitalist oriented cycle. This transit could bring a spirit of collective optimism. Look for progress as this aspect encourages and a perception of deeper potentialities, poses questions and opens up opportunities. This may be particularly opportune at this time with "The Donald" looking to improve the capitalist system which is the USA. Don't look for an immediate event. Look for a swing to the right politically. Revolutionary activity. This aspect has a history of turns. This with the Mercury retrograde period is pointing to the first or second week of 2017 for a turn (down) in the SP500. This would be the potential crest for the current Primary cycle or a 1/2 Primary cycle. If the pullback occurs before this period we will have to re-think the early part of January 2017.
On the other hand, if the society is in crisis it can cause very volatile events to occur without warning amongst an atmosphere of acute tension. There is a dangerous "war mongering" potential for this transit. A quick look at some major charts shows France with transiting Saturn on natal Saturn. Jupiter is almost conjunct the natal True North Node and transiting Pluto quincunx natal Uranus. There could be sudden events particularly over the holiday period. This is based on the French, 5th Republic chart of;
October 5, 1958
0.00 am CET
Paris, France
48'N52'' 2'E20''
As noted above this is a 14 year cycle. Longer term transits, like this, need time to germinate. This transit with the addition of Pluto in a T-square formation may bring problems to the March / April 2017 timeframe. Nevertheless we can expect exciting, new events as the energy of this transit becomes assimilated. There are other issues involving the 8 year cycle of Venus which will be included in the next subscribers report. March / April 2017 could see major problems in the financial markets.
In addition to this transit Mars will make a number of transits over the holiday period. This could be pointing to a violent period with possibly increased terrorist activity.
The other long term aspect is Saturn trine Uranus, a 45 year aspect. We will cover this important transit in the subscriber report. For our purposes here we will say it has a history in the middle east.
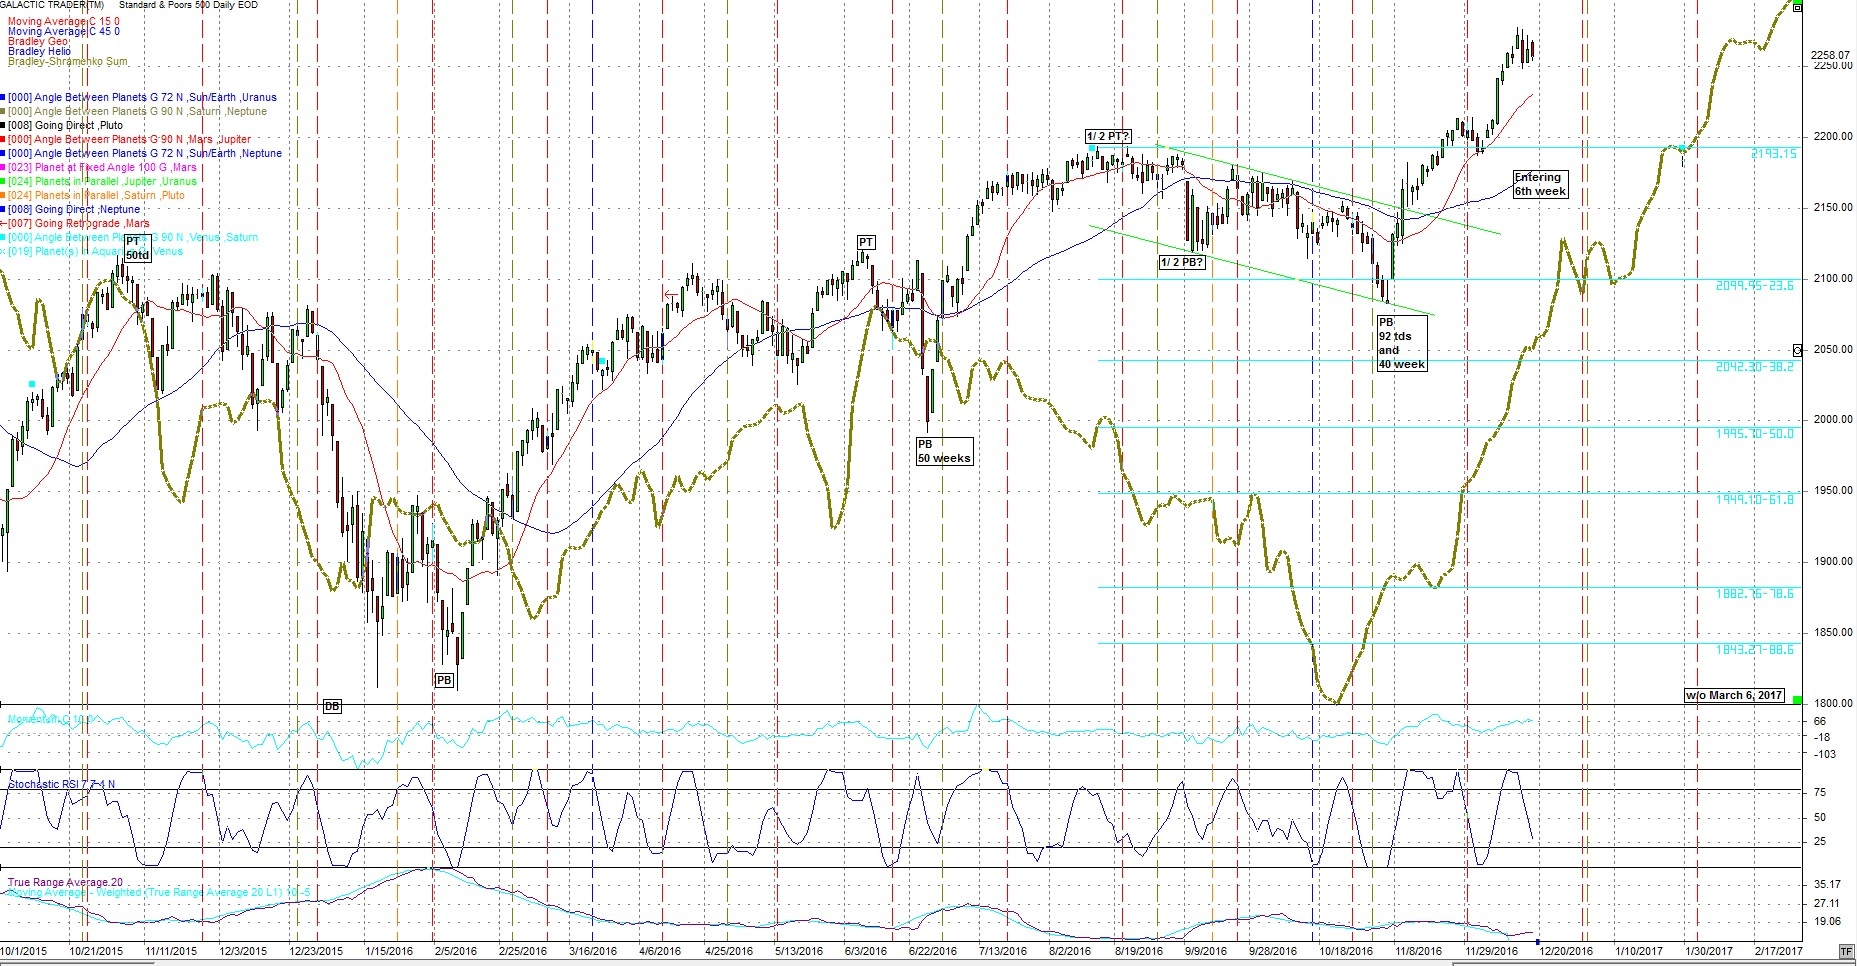
Following is a daily chart of the SP500. The brown line is an adjusted Bradley indicator. It's purpose is to find a change in trend. This is not straight forward to read and the details with video are in section 9 of the subscribers report. Price is now above both the 15 and 45 day sma's. and the 15 day sma is above the 45 day. They both turned up. A usual setup leading out of a Primary cycle low.
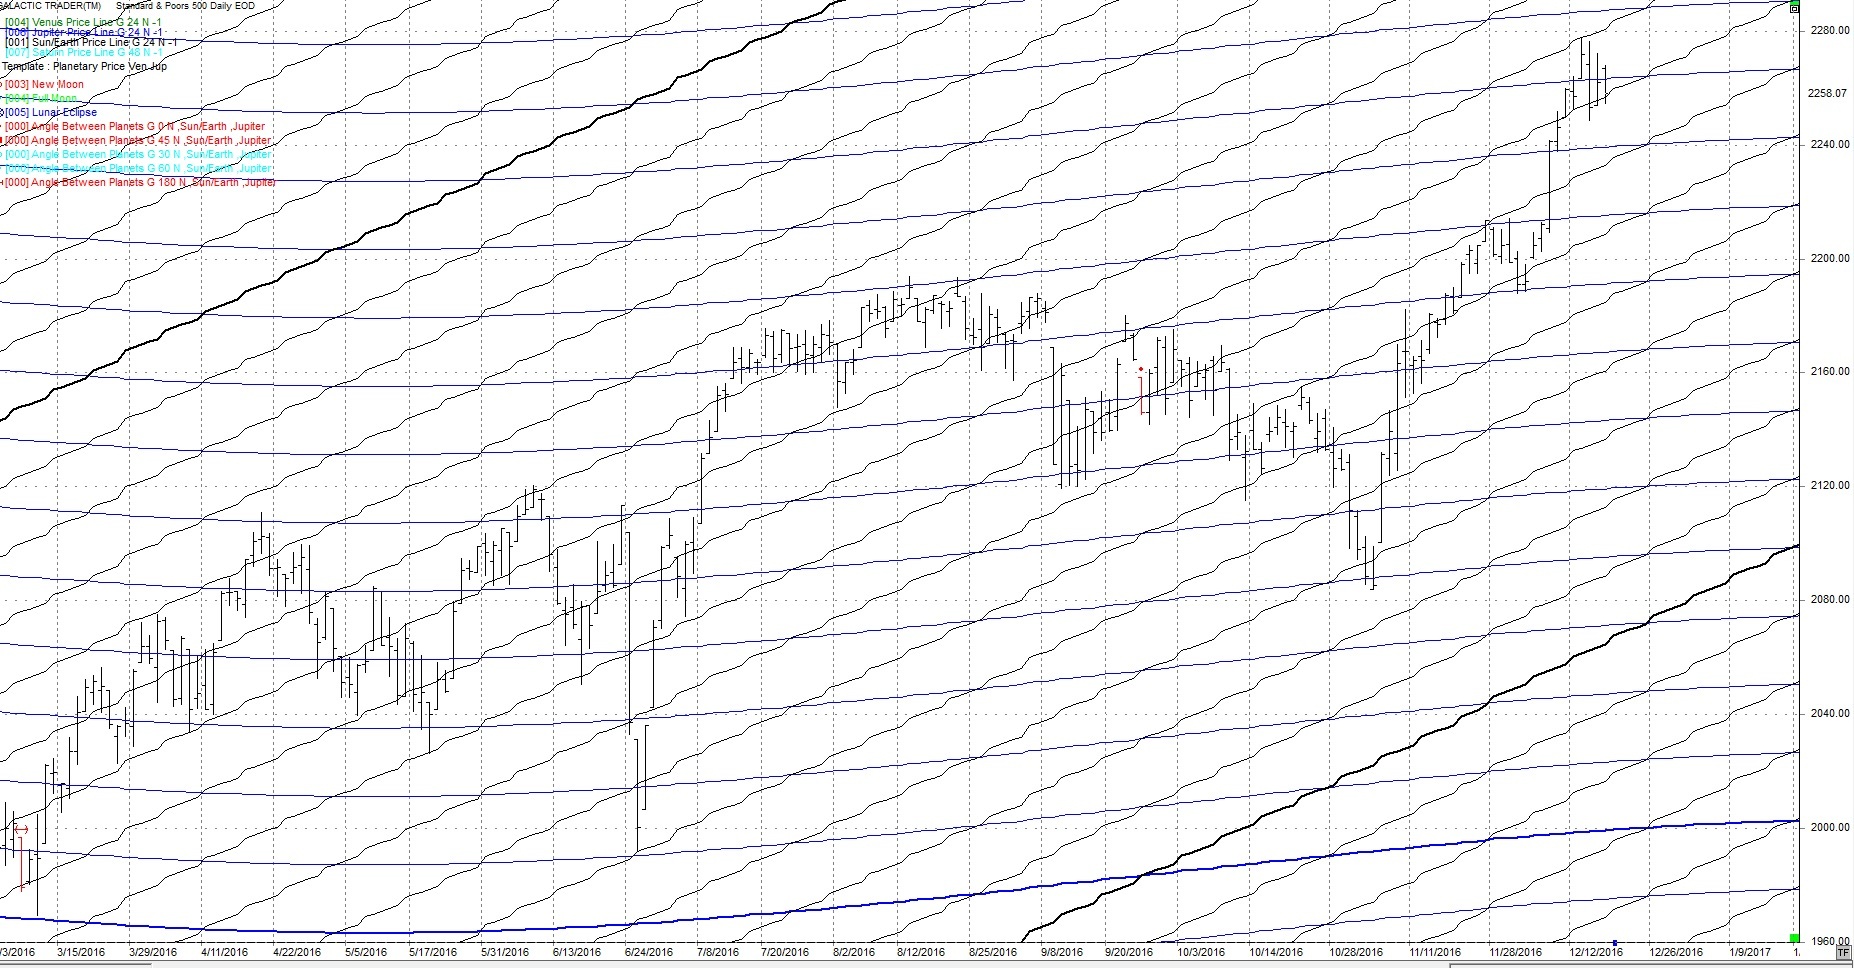
As far as aspects go, the Sun and Jupiter have an affinity for the SP500. The following daily chart of the SP500 shows the Jupiter (blue) price line and the Sun (black) price line. The price line is the longitude of the planets converted to price. On the following chart note the price tends to either reverse or make a sharp move where the Sun price line and Jupiter price line cross. Price has been following the Sun price line up for the last 3 days and 5 of the last 6 td's.
Harmonics
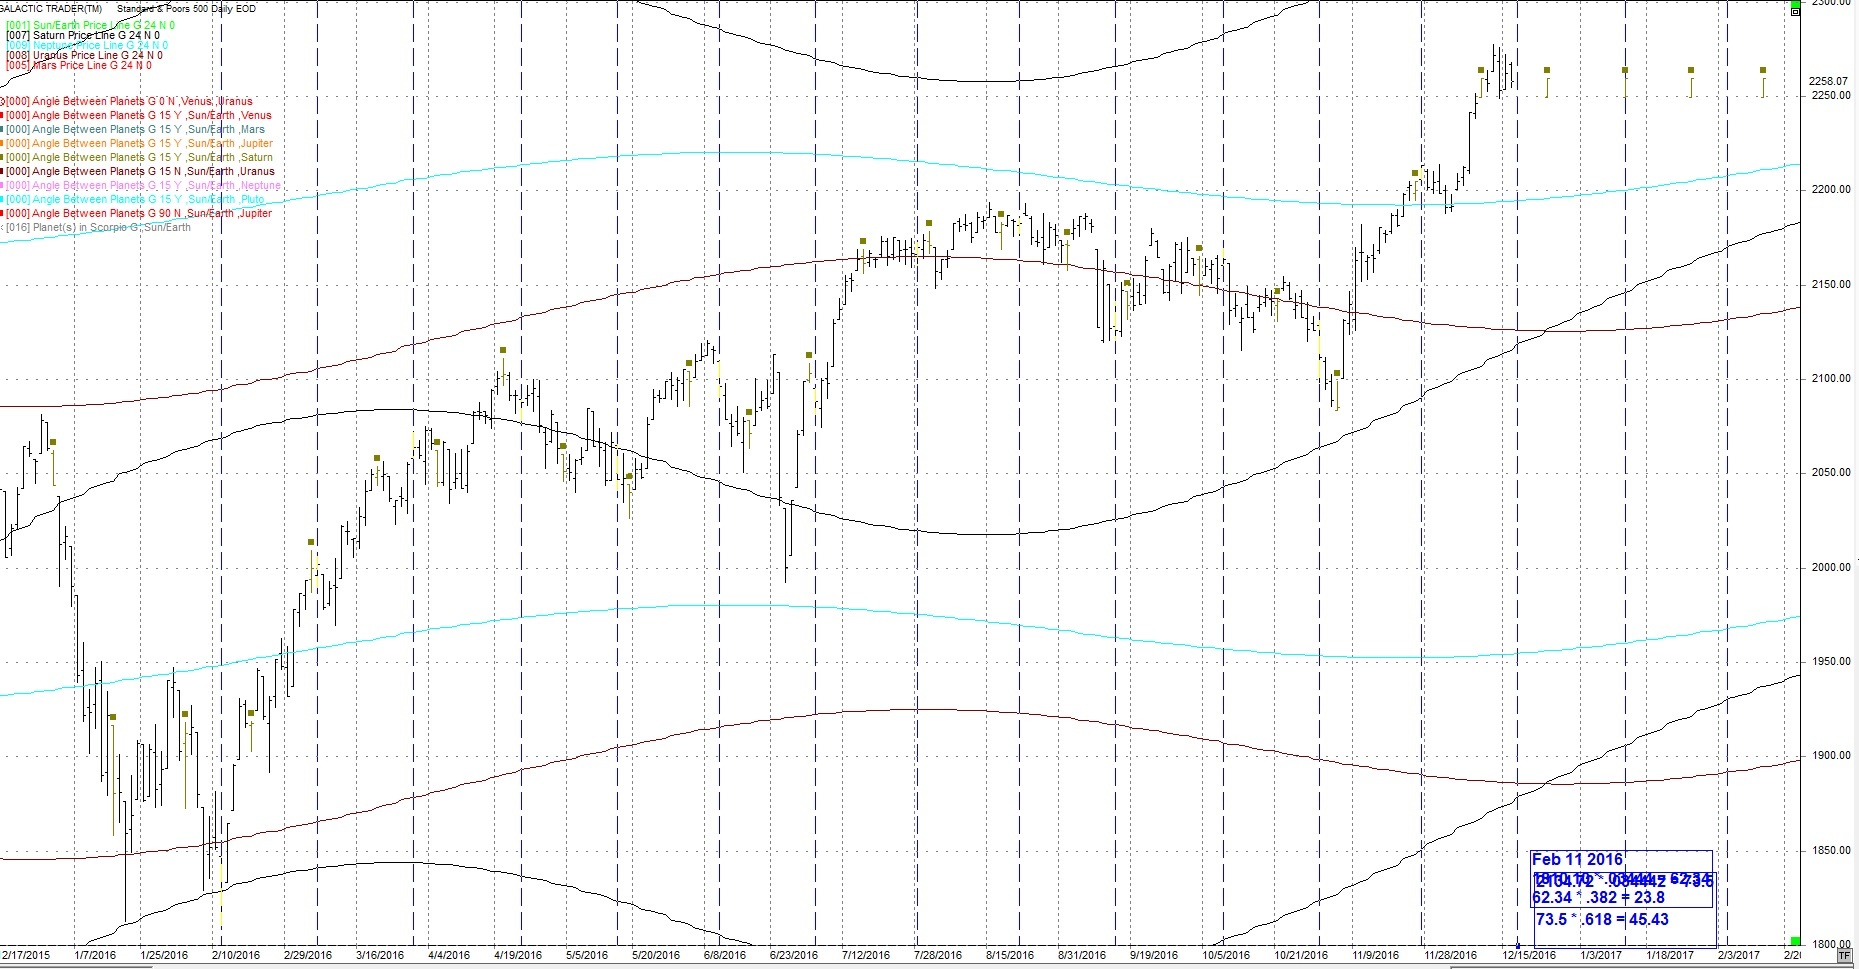
I continue to watch the 24th harmonic cycle (360 / 24) cycles. The brown squares are Sun / Saturn 15 degrees on the following daily chart. The third last hit was
November 4th, the day of the cycle troughs we have been following. The next hits are December 26th then Jan 12, 2017. It may be close to a high.
From last week:
"Watch Dec 12 and 13th, next week. They are often at short changes in trend. "
So far it put in a high on Dec 13th.
I have added 3 price lines to this chart.
Saturn - black
Uranus - purple
Neptune - light blue
These price lines can act as support / resistance. Notice we have just moved down to the Neptune price line (light blue). went through then came back to the Neptune price line then moved up again.
Also on this chart is a blue vertical line which is the 24 cd (calendar day) cycle. It has been at highs and lows. The next date is Dec. 19th, that's Monday, the day Mercury turns retrograde very close to a conjunction with Pluto.
There have been a number of earthquakes over 6.5 this week. I'm expecting more probably over the holiday period.
Author

TradingDaze
Aisys Technologies Inc.
Gordon Lawson, aka TradingDaze, is a Canadian CPA, certified computer programmer and Astrologer. My traditional career spanned 25 years as a Financial Analyst at Suncor and Manager of Information Systems at BP Resources Canada. After this time Mr.


