'SP500 Reversal' seems suitable

For the SP500, cycle-wise November 4th looks like the Primary cycle trough. 1 which puts us entering the 3rd week of a new nominal 18 week cycle. This was quite probably the 40 week cycle trough as well.
The next estimated Primary cycle ( aka nominal 18 week cycle) low is estimated to be March 6th +- 3 weeks with a range of February 13th, 2017 to March 19, 2017. It could also be the week of March 19, 2017 +- 3 weeks. As we get closer I use the upcoming Astros to try and get a more exact reading on when the Primary cycle trough will occur.
We still have a number of Neptune transits this month. I still expect general confusion into early December.
There is another date near the end of the month which could indicate a change. Look to Thursday and Friday this week. where the transit is about change or transformation. Since Pluto is involved it may represent changes to debt. With Venus hitting this aspect on Friday money could be involved. Remember money is debt.
So with the closure of the US markets for Thanks Giving, Thursday and 1/2 of Friday, those who trade in other markets may capitalize on unique opportunities. I trade the TSX.
For those who have been reading this blog for awhile I've been looking for some large deceit or lies being exposed. The whole mess of the scandals in the US election was probably it and includes WikiLeaks and Anonymous.
In addition there is a 12 year aspect hitting near the end of the month. This synodic cycle relates to the growth of international terrorism and political power. It also has evidence of an impact on the economy. In brief, the attainment of power of all kinds.
Following is a daily chart of the SP500. The brown line is an adjusted Bradley indicator. It's purpose is to find a change in trend. This is not straight forward to read and the details with video are in section 9 of the subscribers report.
Following is our normal daily chart for the SP500. Price is now above both the 15 and 45 day sma's. The 15 day is closing in on the 45 day. They both turned up. A usual setup leading out of a Primary cycle low.
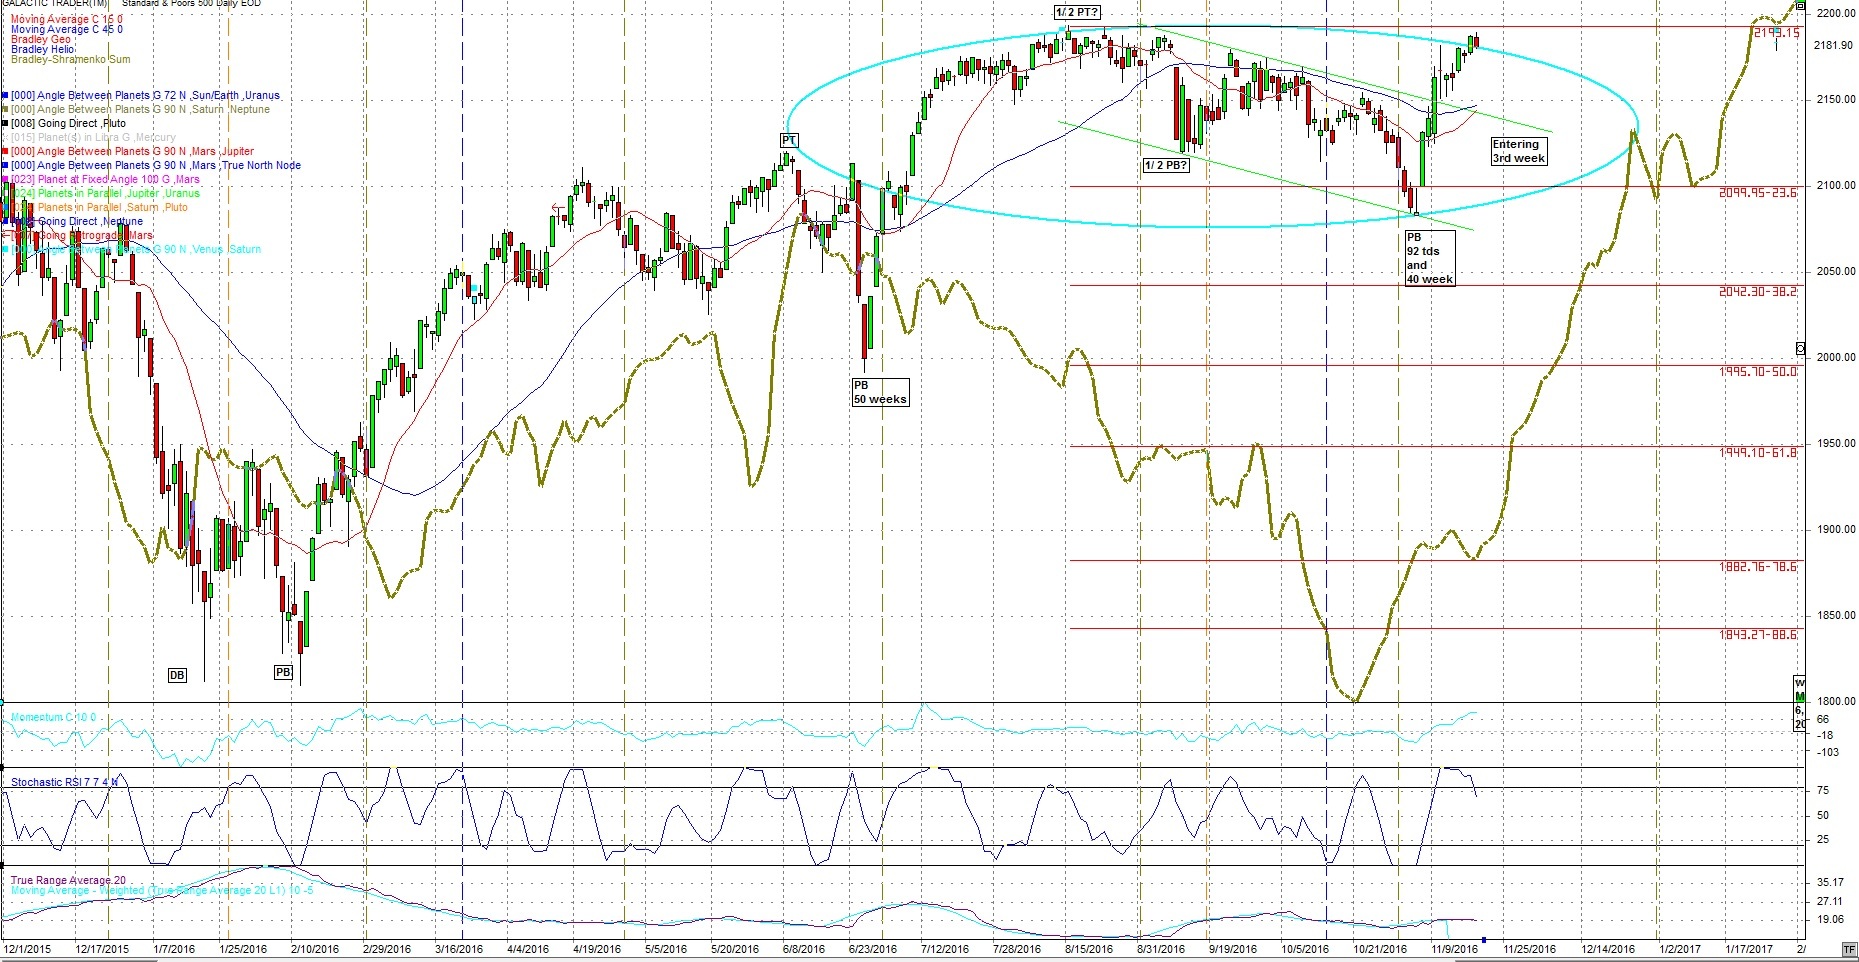
Note, on the above chart the adjusted Bradley (brown line) is turning on November 18th. This should mark a change in trend. For those who have been reading this blog for awhile I have noted there is often a pullback 2 to 4 weeks after a Primary cycle low. So in this case 2 to 4 weeks after November 4th. We are in the 3rd week.
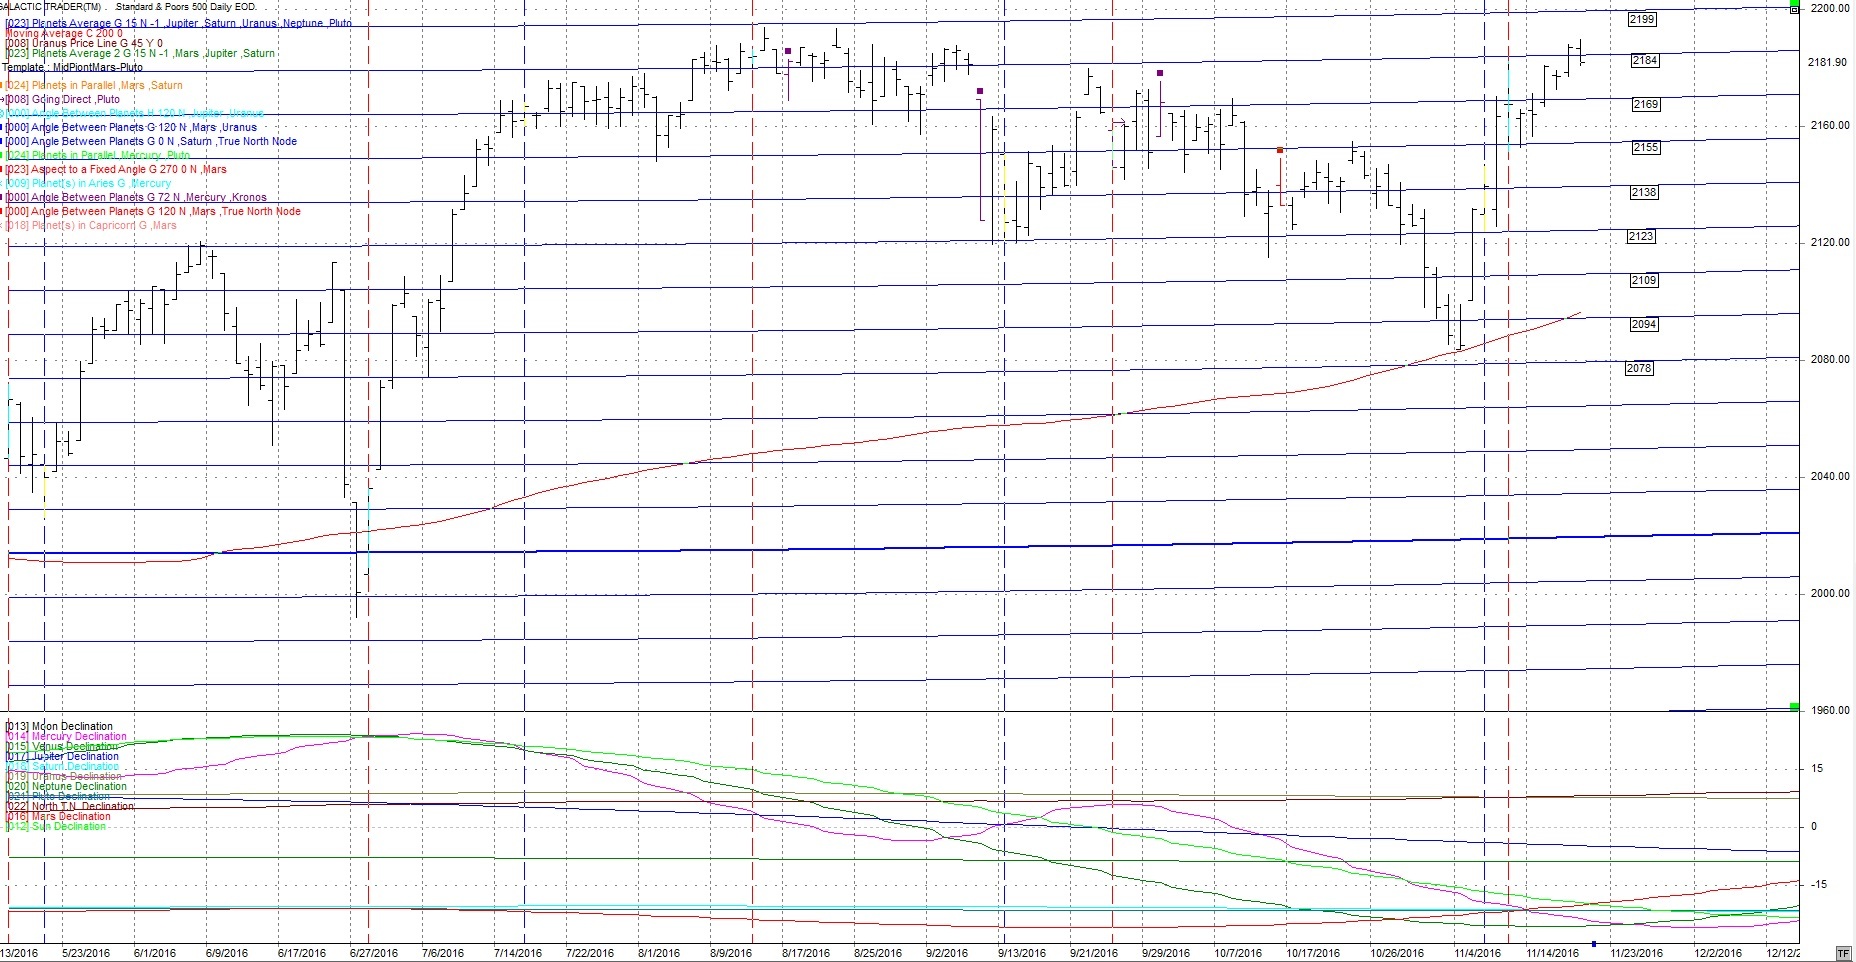
Following is a chart of the planetary average longitude. The horizontal blue lines are based on the average longitude of the planets Jupiter, Saturn, Uranus, Neptune and Pluto which are converted to price. The levels this calculates typically are excellent points to place sell or buy stops. I often use them with Fibonacci retracement levels as well. Price ended at 2,2181.90 very close to the 2,184 planetary average. Price opened above the 2184 planetary average and closed below it.
I'll give the following one more week.
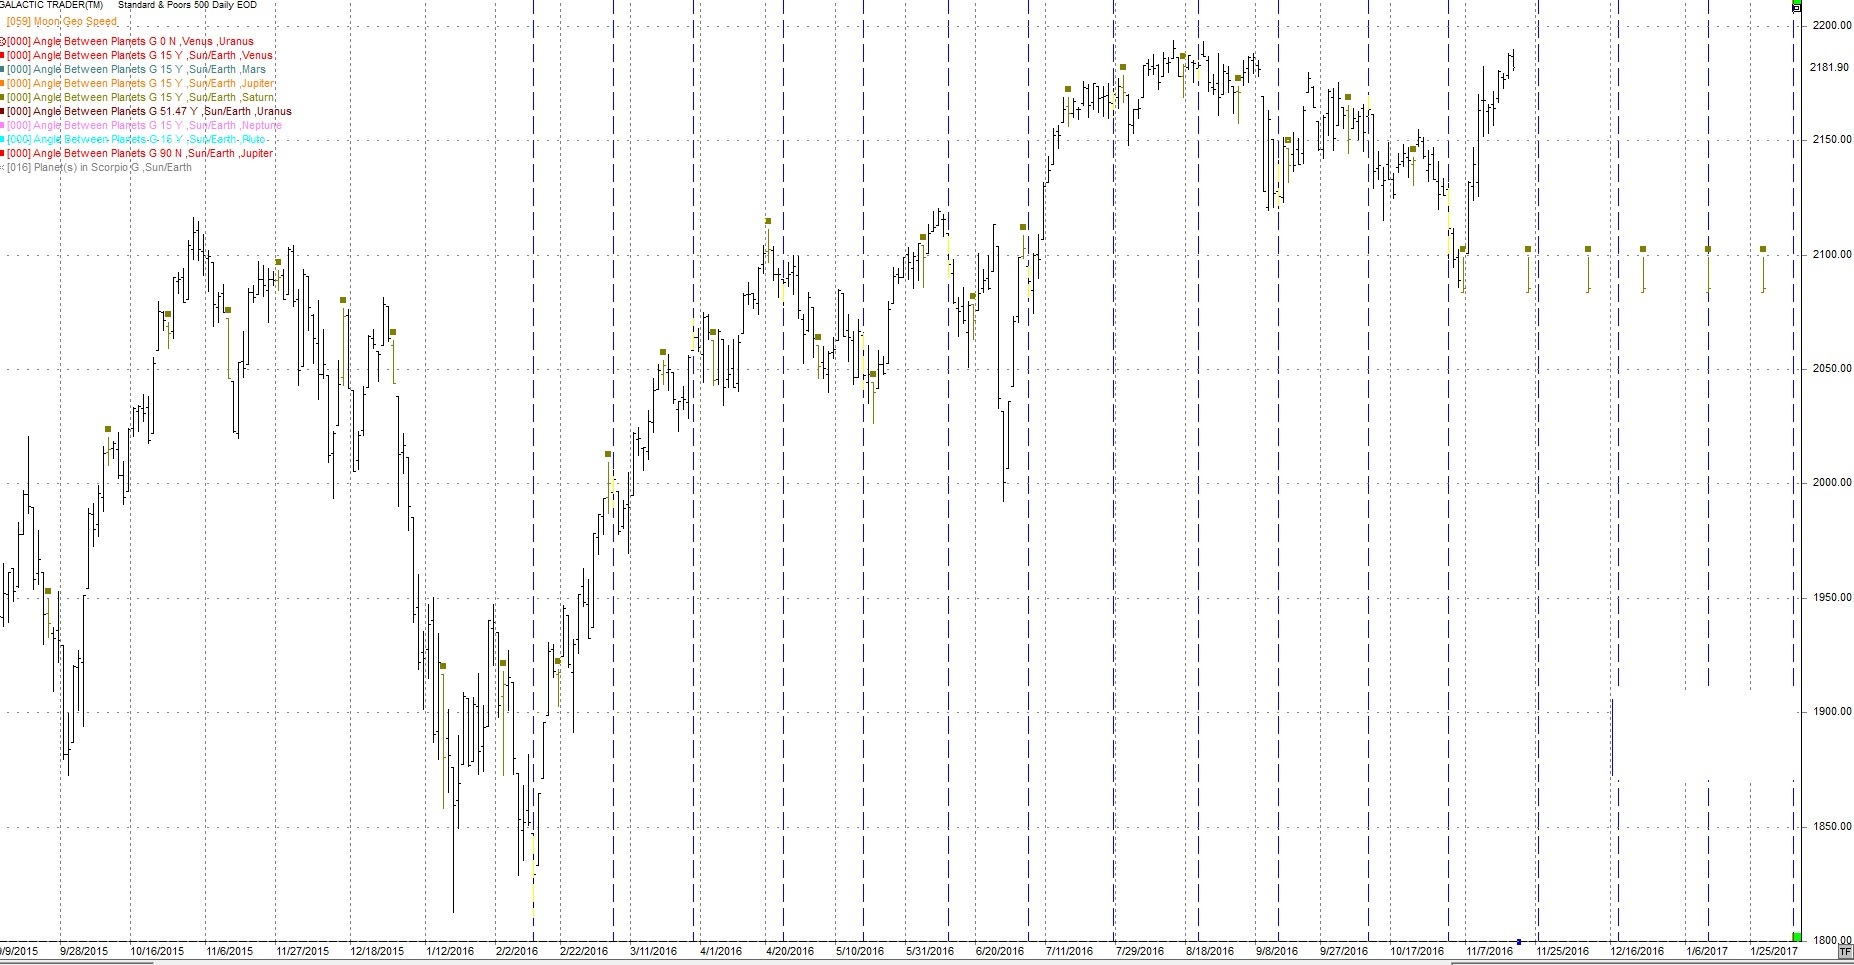
There is another longer term cycle hitting next week, the 377 trading day cycle. I believe I got this cycle from Stan Harley some time ago. Being longer term it' needs a wide orb +- 1 or 2 weeks. The November 4th low could have been it or it is directly ahead. Note it has been at highs and lows. See the red vertical lines on the following chart. I bring this up only to warn of the possibility. This cycle often appears when Venus is Out of Bounds in either north or south declination. Venus is Out of Bounds now and will continue OOB until December 5th, 2016.
Harmonics
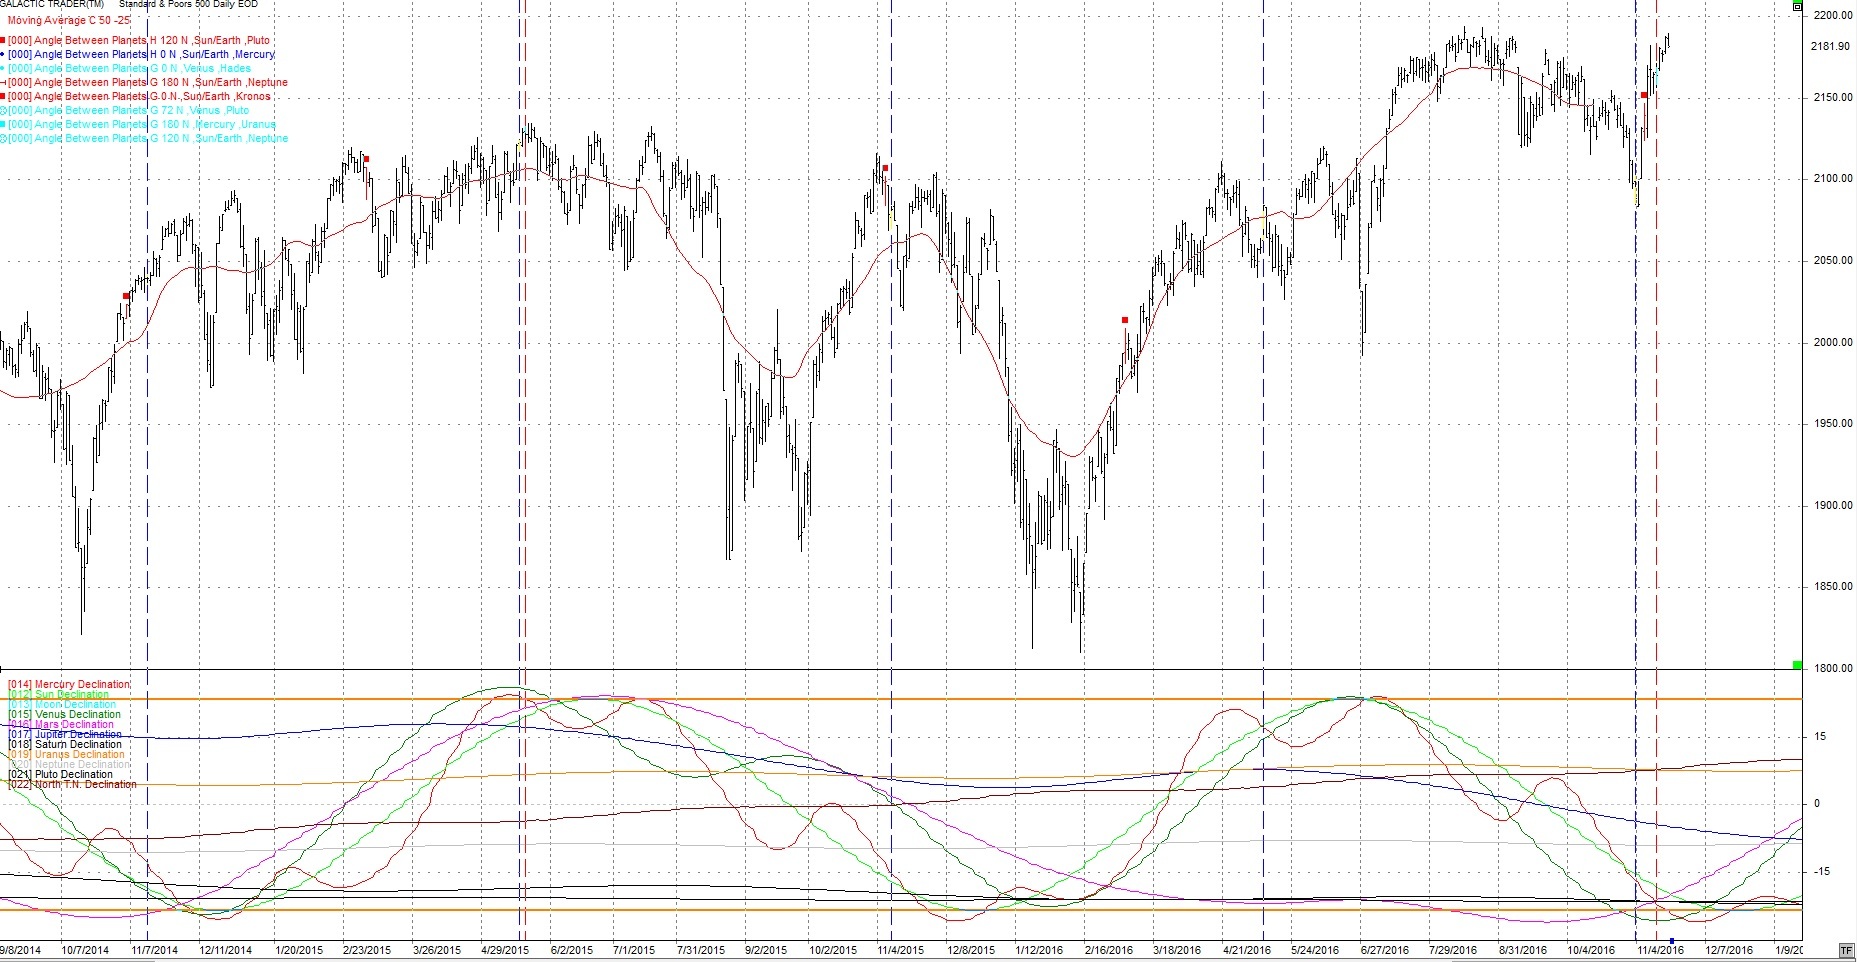
I continue to watch the 24th harmonic cycle (360 / 24) cycle between the Sun and Saturn, which are the brown squares on the following daily chart. The last hit was
November 4th, the day of the cycle troughs we have been following. The next hits are then Nov. 23rd and Dec. 9th. They are often at short changes in trend.
Rumors from the FED that Yellen wants a "high-pressure economy" meaning increased inflation with no rate cuts. There were also rumors of the FED buying stock directly. They should review Japan again.
"Prediction is very difficult, especially about the future."
-- Neils Bohr
Author

TradingDaze
Aisys Technologies Inc.
Gordon Lawson, aka TradingDaze, is a Canadian CPA, certified computer programmer and Astrologer. My traditional career spanned 25 years as a Financial Analyst at Suncor and Manager of Information Systems at BP Resources Canada. After this time Mr.


