SP500 Nov 5, 2018 - Volatile Week

SP500
The last Primary cycle trough started on June 28, 2018 and may have completed it’s Primary cycle on Oct. 29, 2018. Please note we could have a secondary pull back so the Primary cycle trough is not firm yet. Markets should be volatile next week with the mid-term elections on Nov 6 and the FOMC meeting on Nov 8th.
If that was the Primary cycle low then we are in the first week of a new Primary.
If the current Primary takes out the Feb 9th low at 2532 we may be looking at a much larger drop. I’m bring this up as a possibility. I think the low is in.
Price is below the 15 day sma and the 45 day sma and the 15 day sma is below the 45 day sma. Both averages are pointed down. We are in a period of volatile congestion.
The recent move down was timing the 18-week Primary cycle and a 2 year cycle. The longer term cycles (2 year) can distort the smaller term cycles (18 week).
September 21 seems to be the crest of the current Primary cycle.
The following dates may have significant moves or start a move. When the Primary cycle trough is confirmed the later dates will not apply.
Nov 6 North Node enters Cancer
Nov 6 Uranus squares the North Node and enters Aries (backwards, it’s retrograde)
Experience of upsets when together with other people.
People advocating for reforms
Difficulty in unions od people.
Nov 6 Sun trine Neptune
Often marks a high then down
Weakness and illness.
Uncertain times, masses of water
Mid-term elections in the USA
Nov 7 Jupiter trine the North Node
Unexpected good acquaintance, fortunate unions
Nov 8 Jupiter enters Sagittarius
May involve the start of inflationary periods.
FOMC
Nov 16 Venus Direct
Mercury Retrograde
As usual dates are a minimum +- 3 tds. On longer timed aspects a time frame will be included.
Nov 6 are the USA mid-term elections. We should be aware of actions by either political party which could affect the markets.
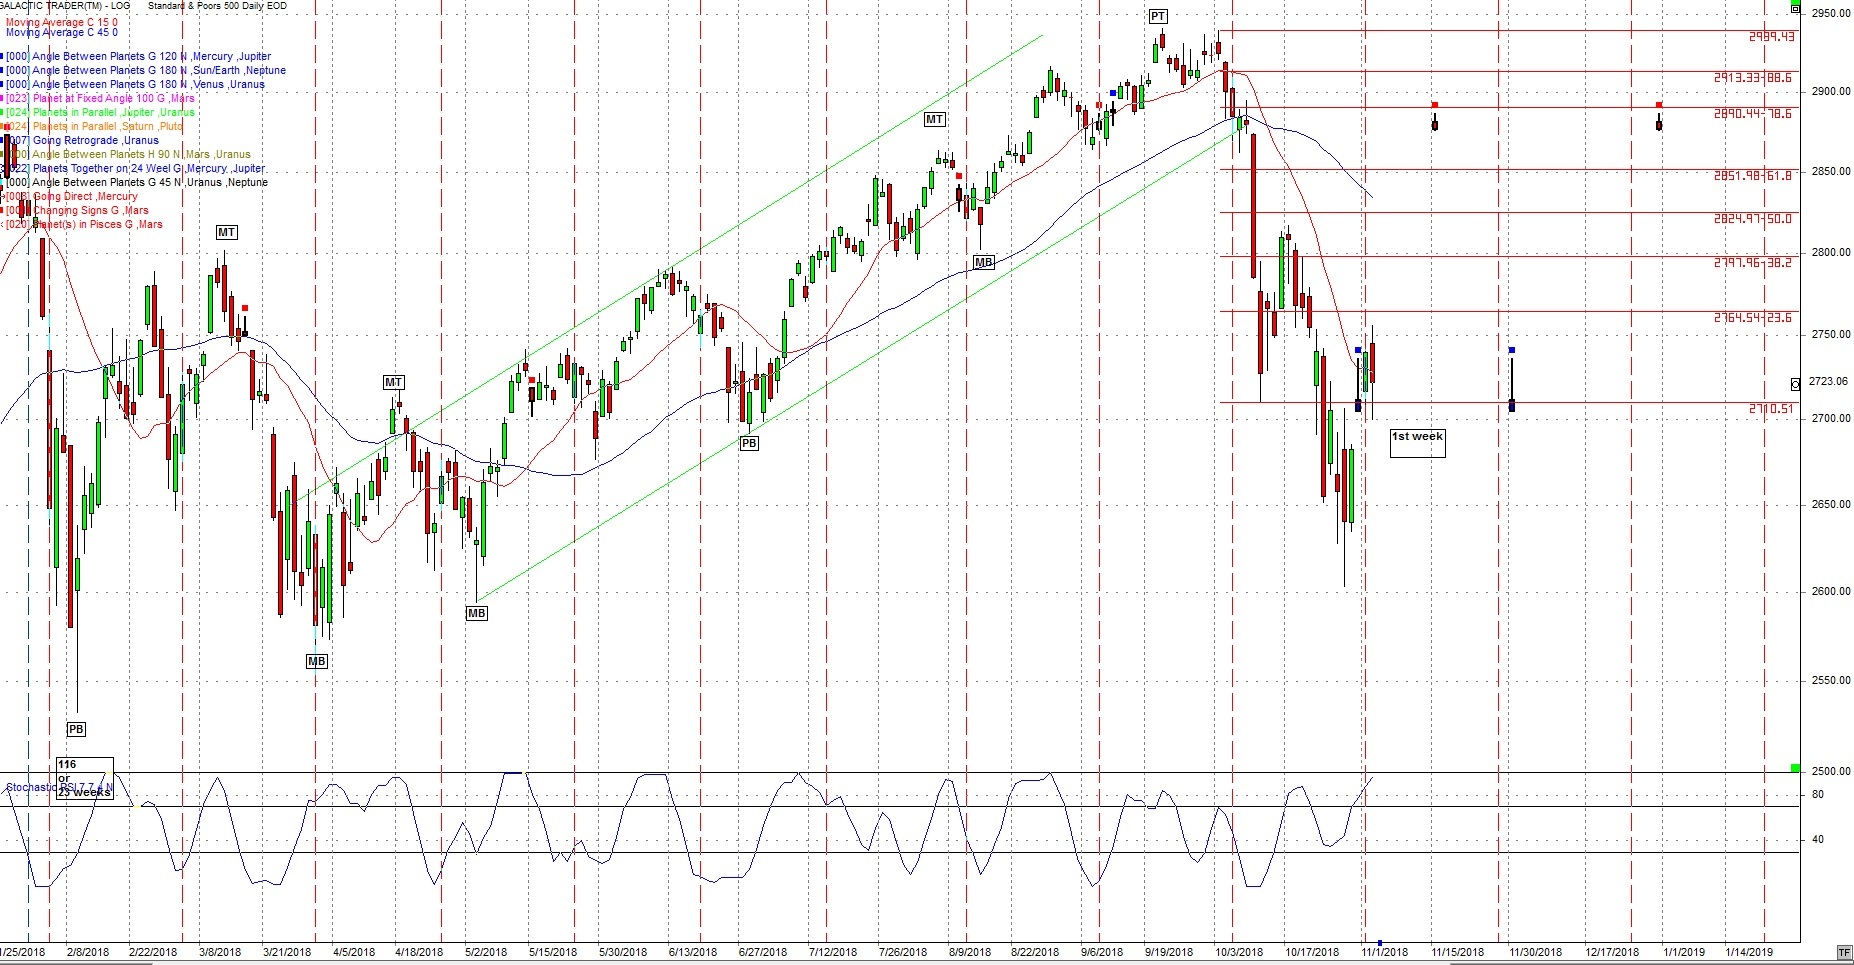
The following daily chart of the SP500 is what we have been showing under the 24 Harmonic chart. This is the basis of what we have been forecasting on.
Following is the 24 Harmonic chart we have shown for many months.
The next hits are Nov 13, 2018 and Jan. 2, 2019. The latter number is on the Uranus price line. Watch closely.
Both could be big moves or big range days.
The 9 month cycle
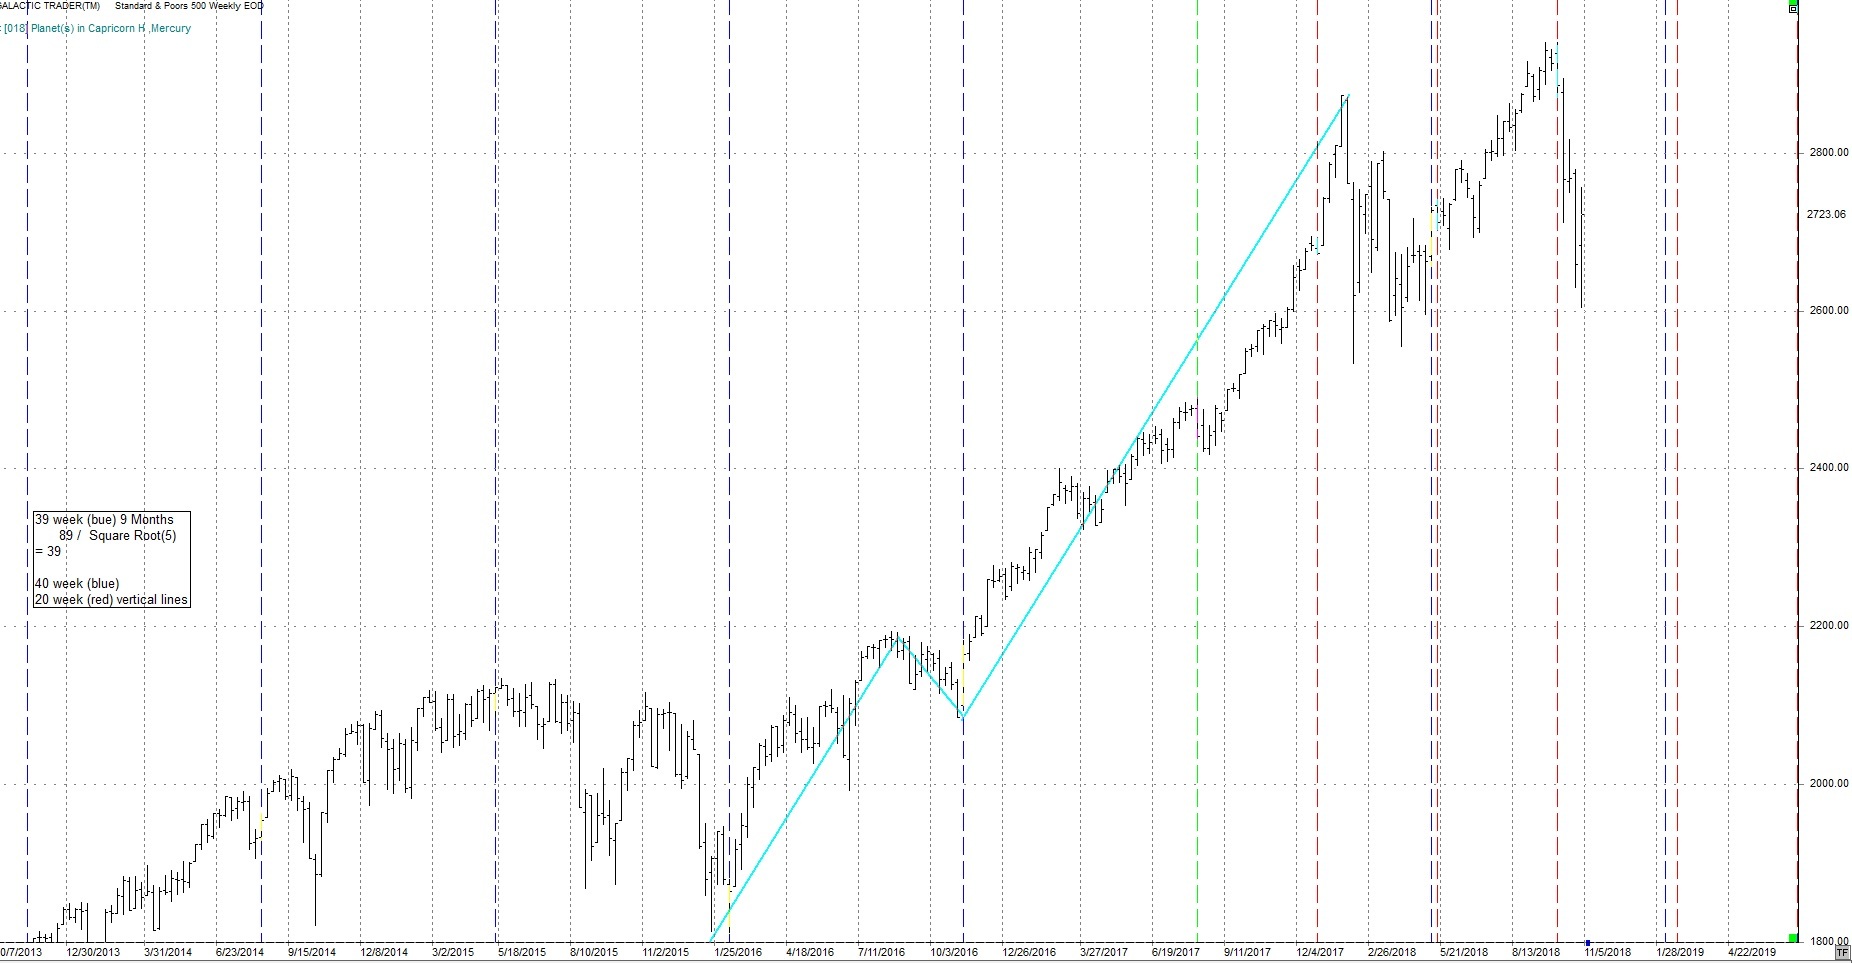
The above chart shows the 9 month or 39 week cycle (blue vertical lines). It was due and appears to have formed in late October. The 20 week cycle was added as well (red vertical lines). Any green lines are a combination of the 20 and 40 week cycles. The 20 week cycle was only 1 day away from the sharp move down.
From the last few posts:
“This coming year could see an increase in geophysical activity, both earthquakes and volcanos.”
See the link under “Earthquakes”. This is an application from the USGS.
There has been a number of volcano’s erupting as well. Japan and Hawaii.
On a longer term basis the following monthly chart of the DJIA shows the 15 year cycle (red vertical lines) and the 45 year cycle (blue lines). The 15 year is due now or took place April – June 2018. The 45 year due in Sept 2019. This is another example of a longer-term cycle possibly distorting shorter term cycles. Bear in mind they need a broad orb.
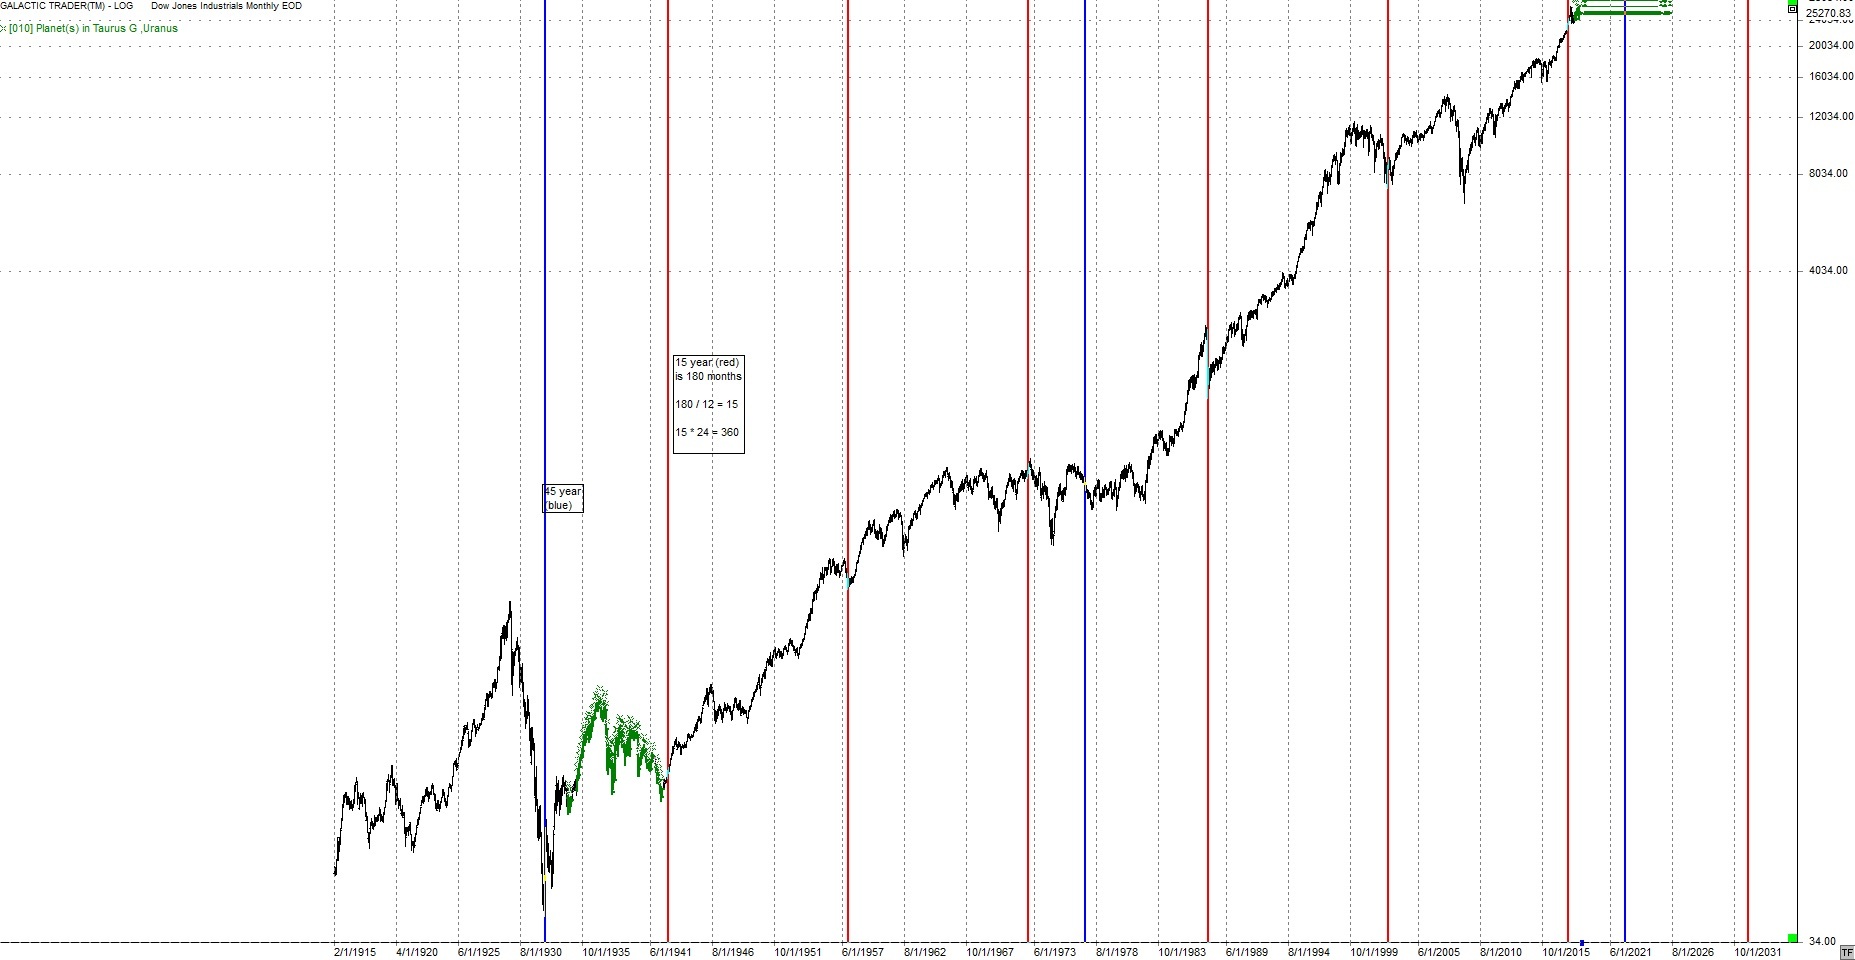
Regarding a note from a reader the 45 year cycle is the ½ cycle to the 90 year cycle. It is the vertical blue lines.
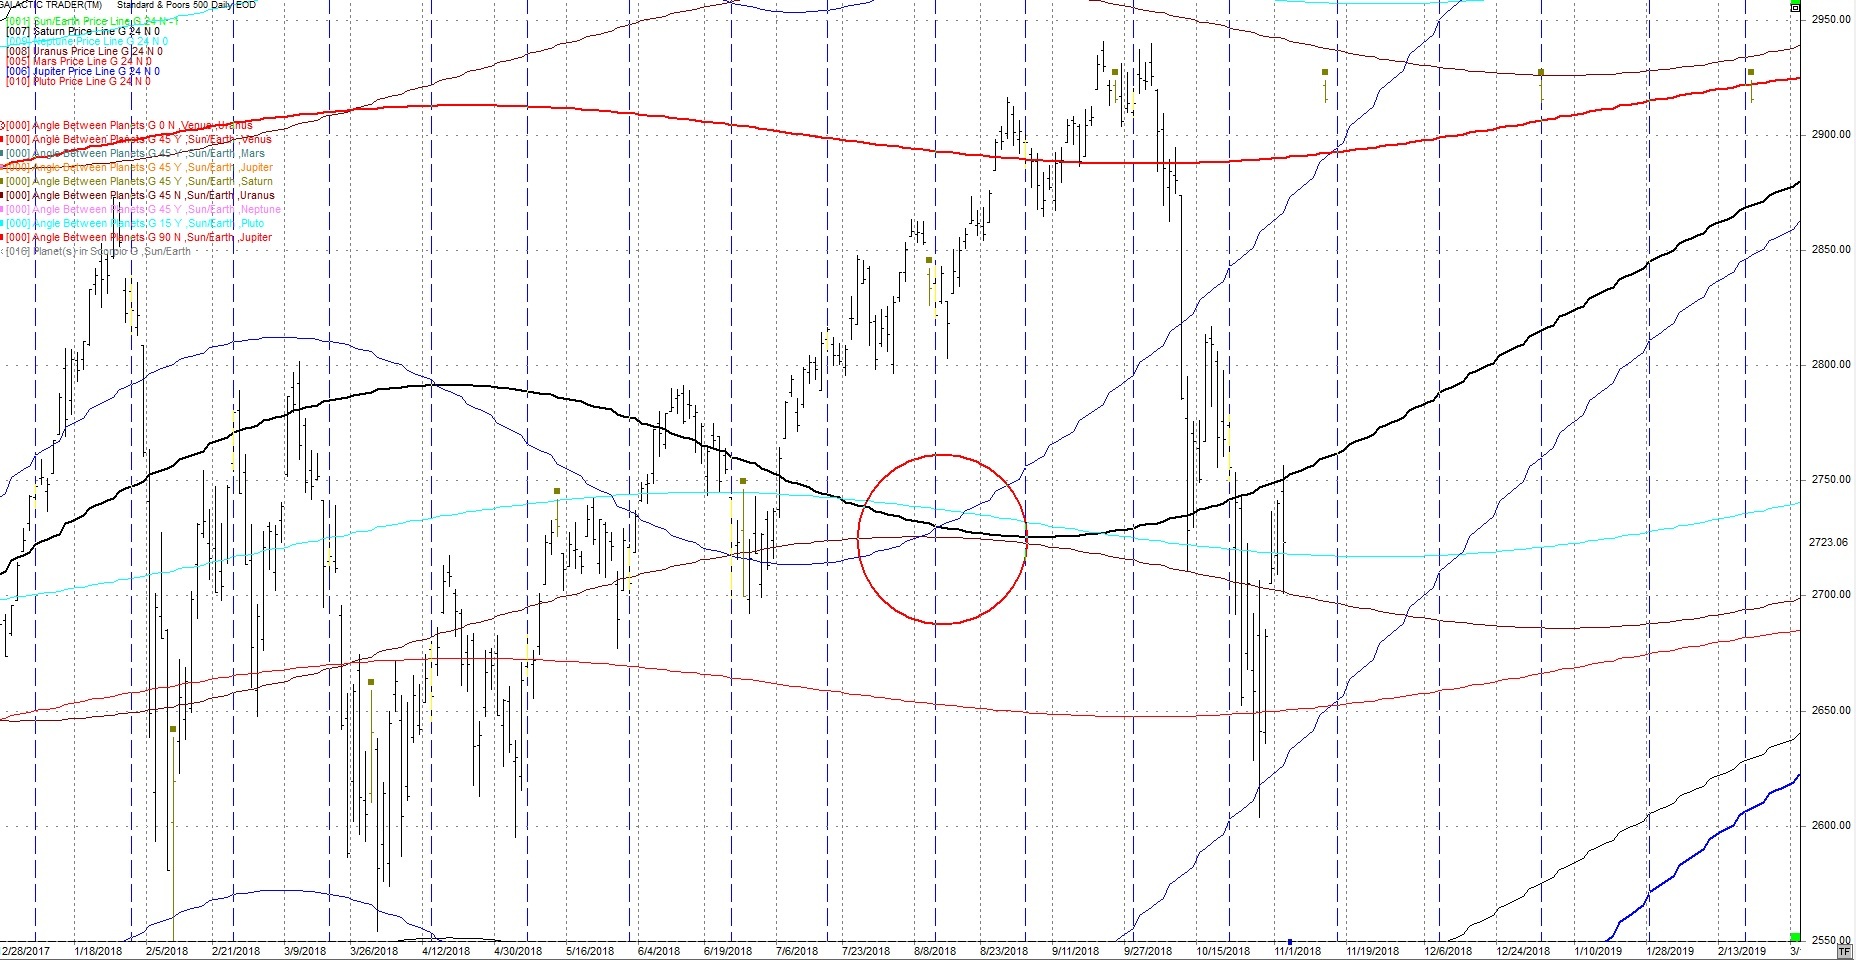
The following daily chart of the SP500 shows 2 Envelope channels. Red is the centered
20 week envelope channel. Blue is the centered 40 week envelope channel. The dark blue squares are the Sun / Neptune square which is often a short term change in trend.
We have had this noted it was due for a sell. Also note the dark blue squares. They are the dates of the Mars square Uranus transit.
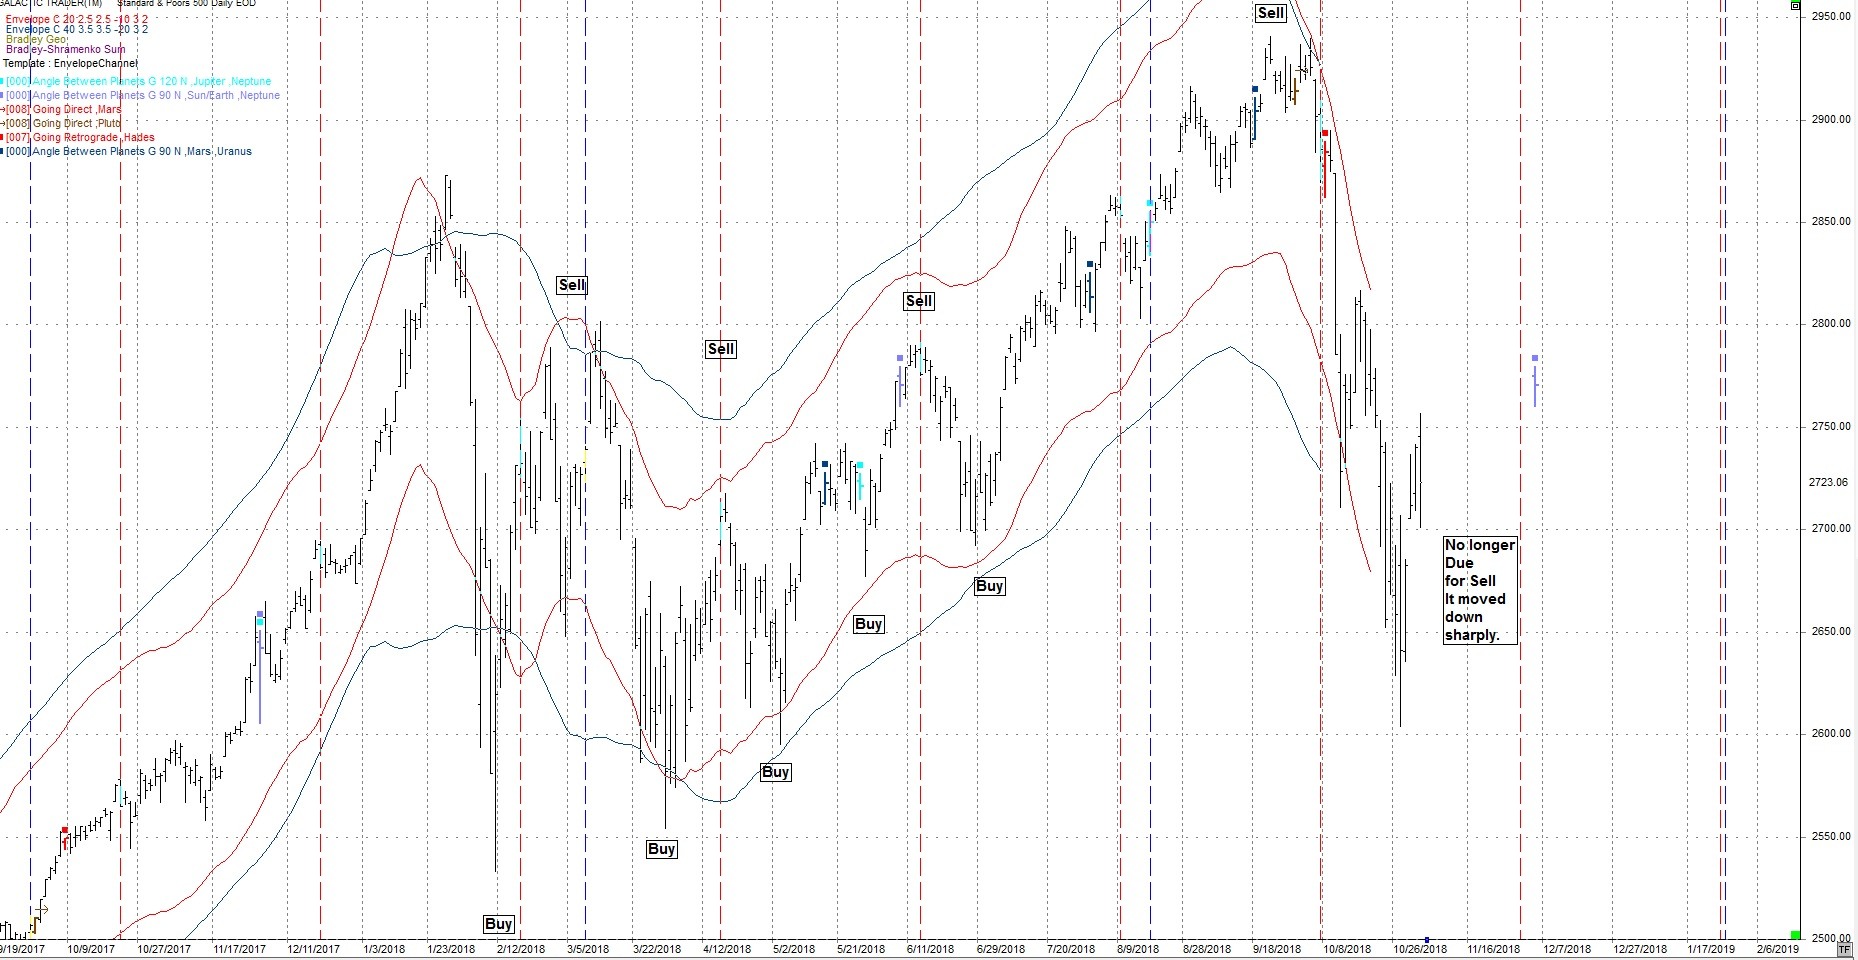
We are entering the difficult time mentioned over the last few months.
The envelope channel charts are easy to calculate. In the above case the blue lines are based on a 40 day average but when they are plotted they are centered. For a 40 day it will be shifted by 20 days which is the ½ cycle.
The red averages are based on the 20 week so they are shifted 10 weeks or a ½ cycle.
I brought up Iran on the last post. I’ll come back to those charts on any potential signs of conflict. It is getting close. Watch the news for problems with Iran.
Longer Term
Uranus and the North Node.
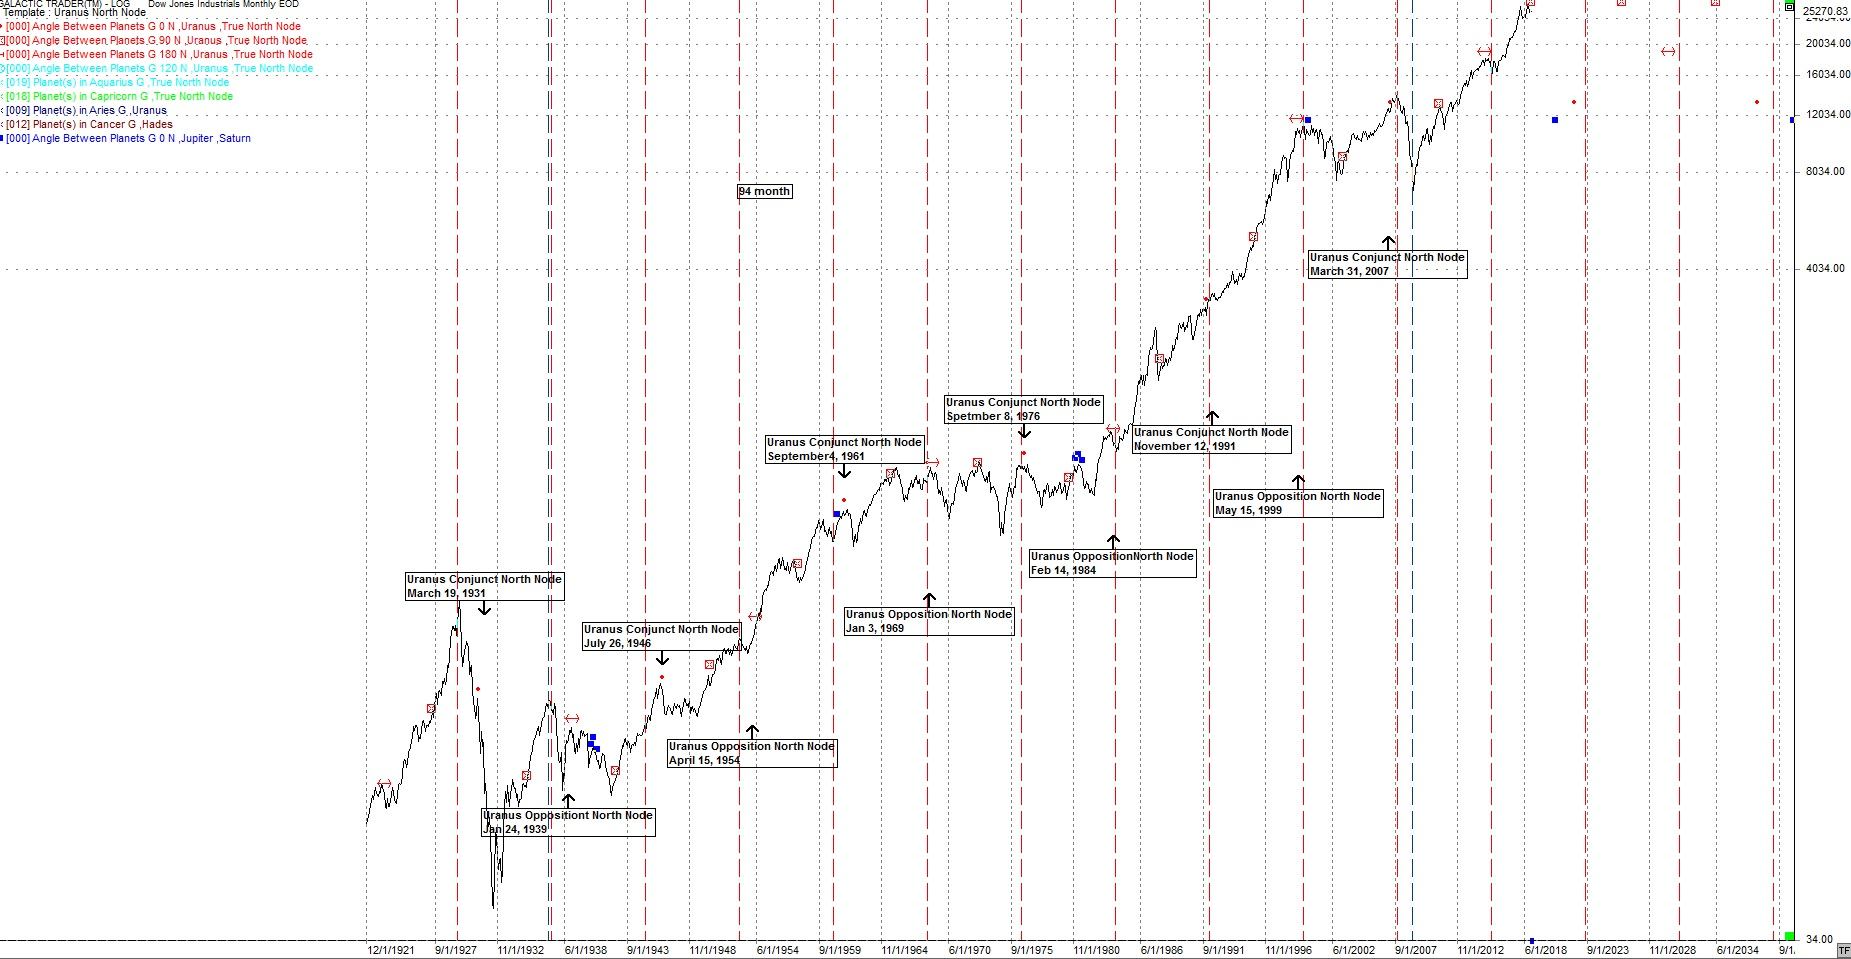
Following is a monthly chart of the DJIA.
The red vertical lines are a 94 month cycle.
The main Astros on this chart are the aspects between Uranus and the North Node.
The small red circle is the conjunction.
The double arrow is the opposition.
The red square is the 90 degree square.
Note how the DJIA acted as these aspects are hit.
The next conjunction is in July 2022.
The next square is November 6, 2018. This is the same day as some other Astros above and the day of the mid-term election.
November 6 may be a significant date.
4 Year
Other longer-term aspects like the 4 year cycle are coming due. The SP500 4 year cycle should be due in mid to late 2019.
The Primary cycle top on Sept 21, 2018 at 2490.91 may have been the top for the 4 year cycle.
Other
Another very long term cycle, the 90 year, is potentially around 2022 +- a lot. More time is needed to confirm this cycle. The ½ cyc;e to the 90, the 45 year ties into the 90 and is due in the same time frame.
Author

TradingDaze
Aisys Technologies Inc.
Gordon Lawson, aka TradingDaze, is a Canadian CPA, certified computer programmer and Astrologer. My traditional career spanned 25 years as a Financial Analyst at Suncor and Manager of Information Systems at BP Resources Canada. After this time Mr.


