SP500 Moves After Jan 20th

SP500
For the SP500, cycle-wise November 4th was the Primary cycle trough. 1 which puts us entering the 11th week of a nominal 18 week cycle. Nov. 4th was the 40 week cycle trough as well. We could be looking at a 1/2 Primary cycle crest and then down. A point for subscribers. The 1st Half 2017 Forecast dates are estimated from Astrological events only. As time unfolds we have the benefit of market cycles and possibly additional Astrological events. Nevertheless the original dates have fared very well. See the blog post of December 11, 2016, showing the original forecast dates for the SP500. These are the original 6 month dates with no adjustments for the last 3, 6 month periods.
It should be noted Primary cycles (18 weeks) most often start with a 6 week sub-cycle. The 2nd most common start is a 1/2 Primary or 9 week sub-cycles. This now looks like a 1/2 Primary cycle.
The next estimated Primary cycle ( aka nominal 18 week cycle) low is estimated to be March 6th +- 3 weeks with a range of February 13th, 2017 to March 19, 2017. It could also be the week of March 19, 2017 +- 3 weeks. As we get closer I will use the upcoming Astros and market cycles to try and get a more exact reading on when the Primary cycle trough will occur. Early April is another possibility.
Late February through early March 2017 is shaping up to be a possible market turn. March 26 is the first Solar eclipse of the year. This is followed closely by the 2nd opposition of Jupiter and Uranus (2nd of a 3 pass). On that weekend, March 4th Venus turns retrograde, a very important aspect (see notes further down). On
March 7th Saturn conjuncts the Galactic Center. It is the 2 week period defined by the dates above that I expect a move down. This may be very important. Bear in mind we are in an 8 year bull market. A move down could start at any time, the above are the most probable from an Astrological perspective.
This coming week the strongest aspect for a change in trend is Mars square Saturn on January 19th. Assuming the markets are still up they could turn close to January 19th +- 2 td's. The following day is the USA Presidential Inauguration. We may see some social unrest on that day.
Coming up in February there are 2 eclipses, a lunar eclipse on February 10 and a Solar eclipse on February 26. Subscribers will receive a detailed analysis of the four eclipse that will hit in 2017 in the February Subscriber Report. These four eclipses will all aspect Mars. The next couple of weeks have Mars aspects. Mars is the planet of war, conflict and aggression. As mentioned in previous weeks both Israel and Egypt may come to the fore this year as regards to conflict and aggression.
The Jupiter/Uranus opposition will next occur on March 2nd.
The Mercury retrograde period is over. The next retrograde planets for the first quarter are:
Feb 6 Jupiter retrograde
Mar 4 Venus retrograde (could be very important)
December 26 when the US markets were closed for Christmas there is a 14 year aspect, Jupiter opposing Uranus. This is the first of a 3-pass with 2 oppositions in 2017. At times this opposition will be a T-square with Pluto at the Apex. The French Astrologer, Barbault considers this transit to be predominantly a capitalist oriented cycle. This transit could bring a spirit of collective optimism. This may be particularly opportune at this time with "The Donald" looking to improve the capitalist system which is the USA. Don't look for an immediate event. Look for a swing to the right politically. Revolutionary activity. This aspect has a history of market turns. The Jupiter / Uranus opposition is still in orb.
As noted above the 2nd opposition of Jupiter and Uranus occurs March 2, two days before Venus turns retrograde. There is a Venus cycle which could be important. That is every 8 years or 5 Venus retro occurrences, Venus returns to approximately the same spot in the Zodiac. Venus turns retrograde on March 4th 2017. 8 years ago or 5 Venus retro occurrences Venus turned retrograde on March 6, 2009. This was the day of the low in the major US indices.
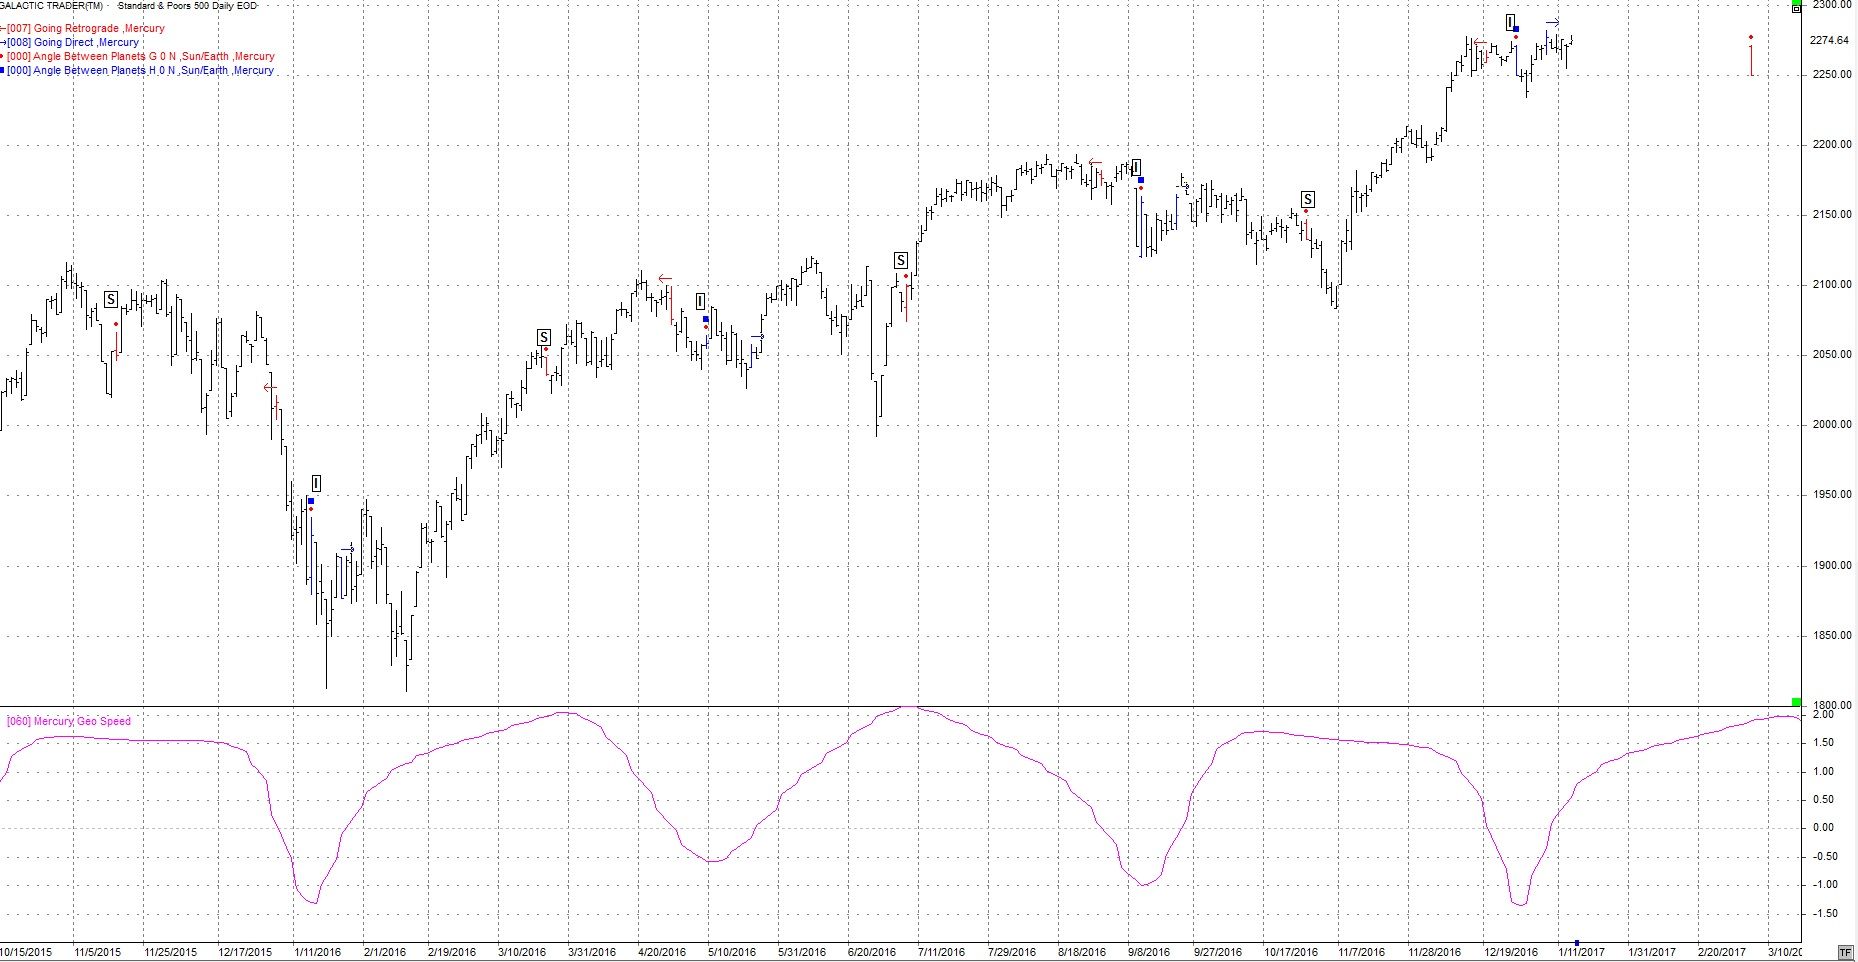
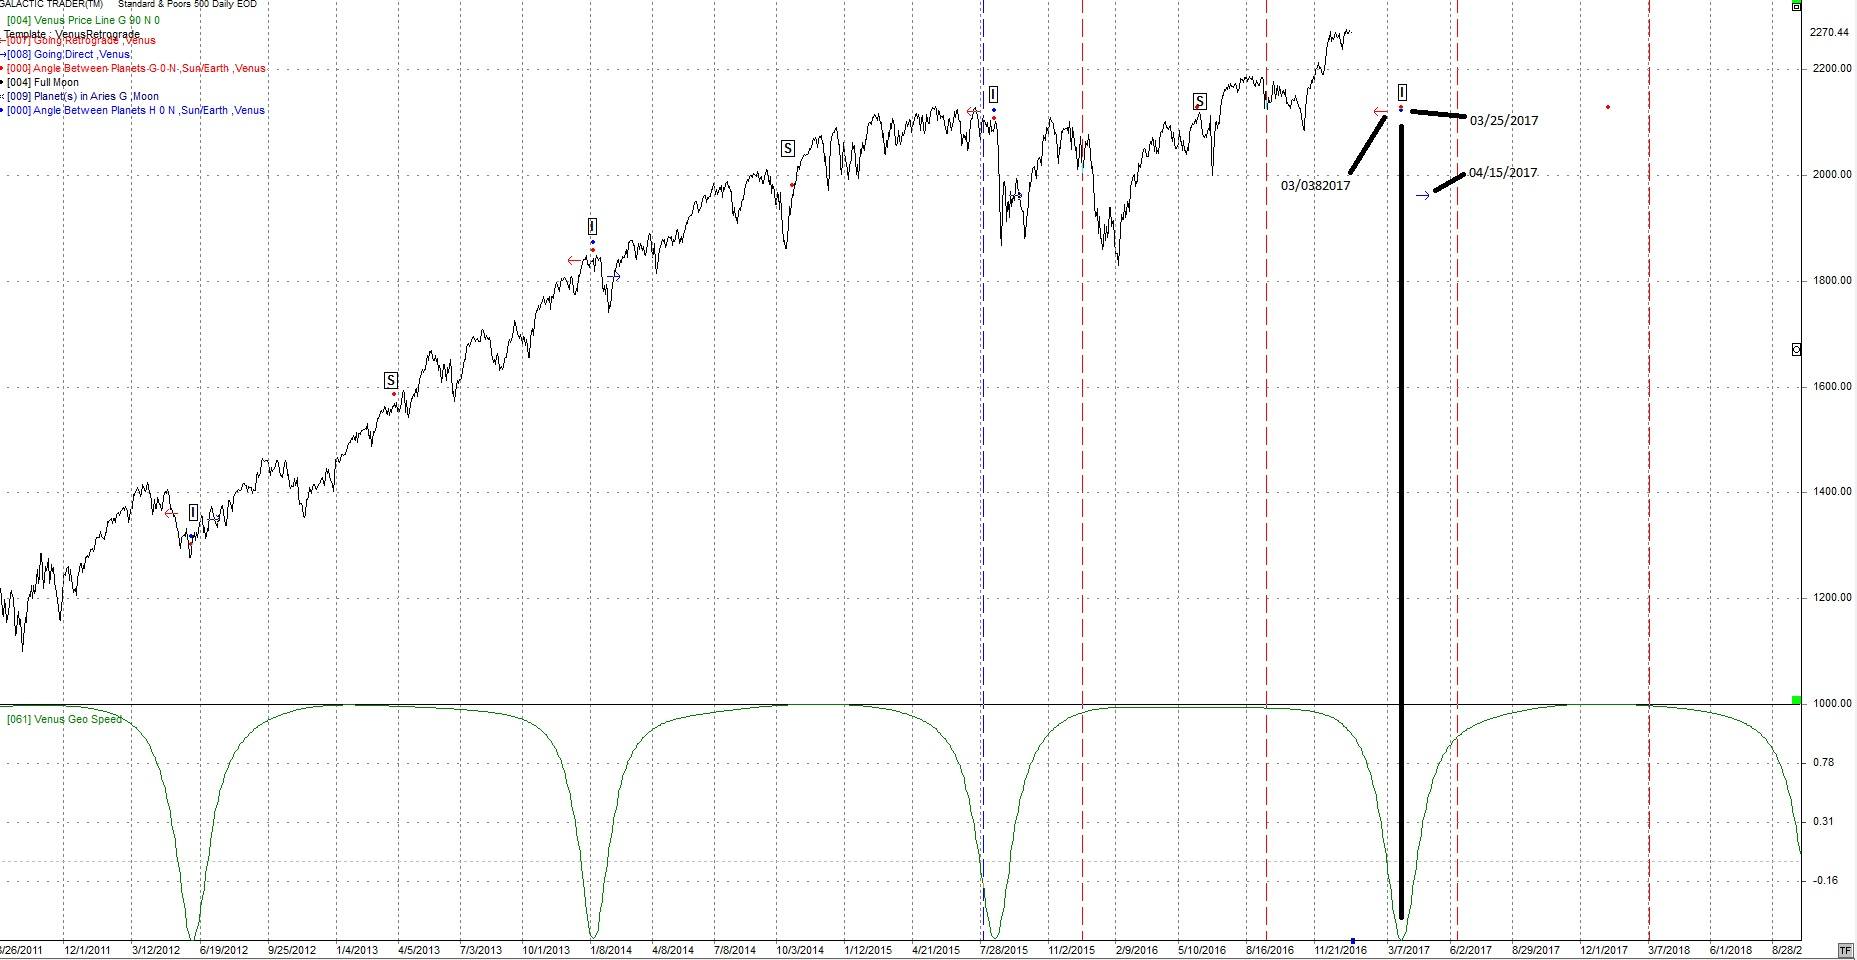
The following chart shows Venus retrograde dates (retro, red arrow pointed left), Venus direct (blue arrow pointed right) and the Sun/Venus conjunct noted as Inferior or Superior, (I or S). Mercury and Venus are the two planets inside the Earth's orbit and the only one's that can have Inferior and Superior conjunctions with the Sun.
A brief review of Trump's transit shows a favorable transiting Jupiter trine Trump's natal Sun. This, in itself is quite favorable. One thing you have to watch out for with Jupiter is things that are over-done.
So we are in a period where a 1/2 Primary cycle is due. We have a major transit Jupiter opposing Uranus being translated by the Sun. From "The Book of Rules" this points to material success, sudden luck and man enjoying himself. Add onto this the soon to be President has very favorable transits on the day of the press conference with Jupiter trining Trump's natal Sun. Things should be volatile. It should also be noted transiting Jupiter just entered Trump's 3rd house. This should be favorable for Trump's communication for the next year.
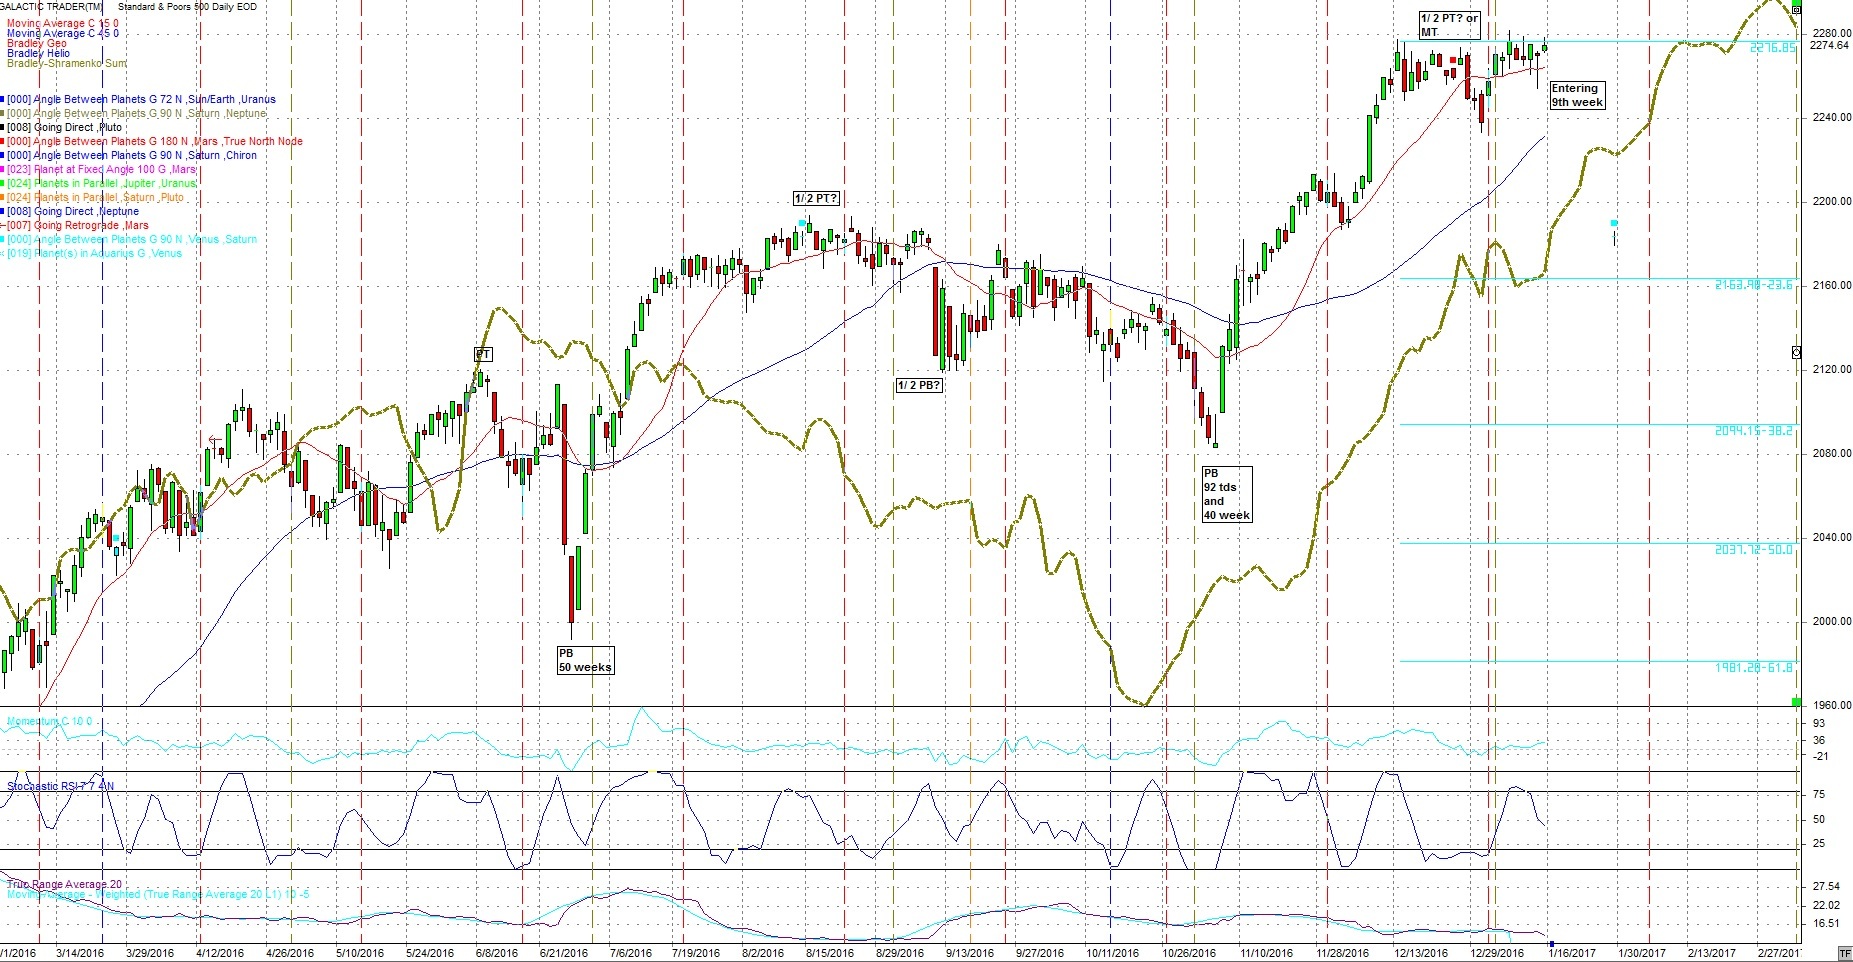
Following is a daily chart of the SP500. The brown line is an adjusted Bradley indicator. It's purpose is to find a change in trend. This is not straight forward to read and the details with video are in section 9 of the subscribers report. The SP500 put in a brief low on December 30. Note the Bradley indicator made a 'V" shaped low on that date. On
January 13th the Bradley has another turn. Give it +- 2 td's Price is now above both the 15 and 45 day sma's. and the 15 day sma is above the 45 day. For the 1/2 Primary cycle we need to see price start moving lower. This may be the period around January 19th.
The January 2017 subscribers report will outline some longer term Astrological aspects and events.
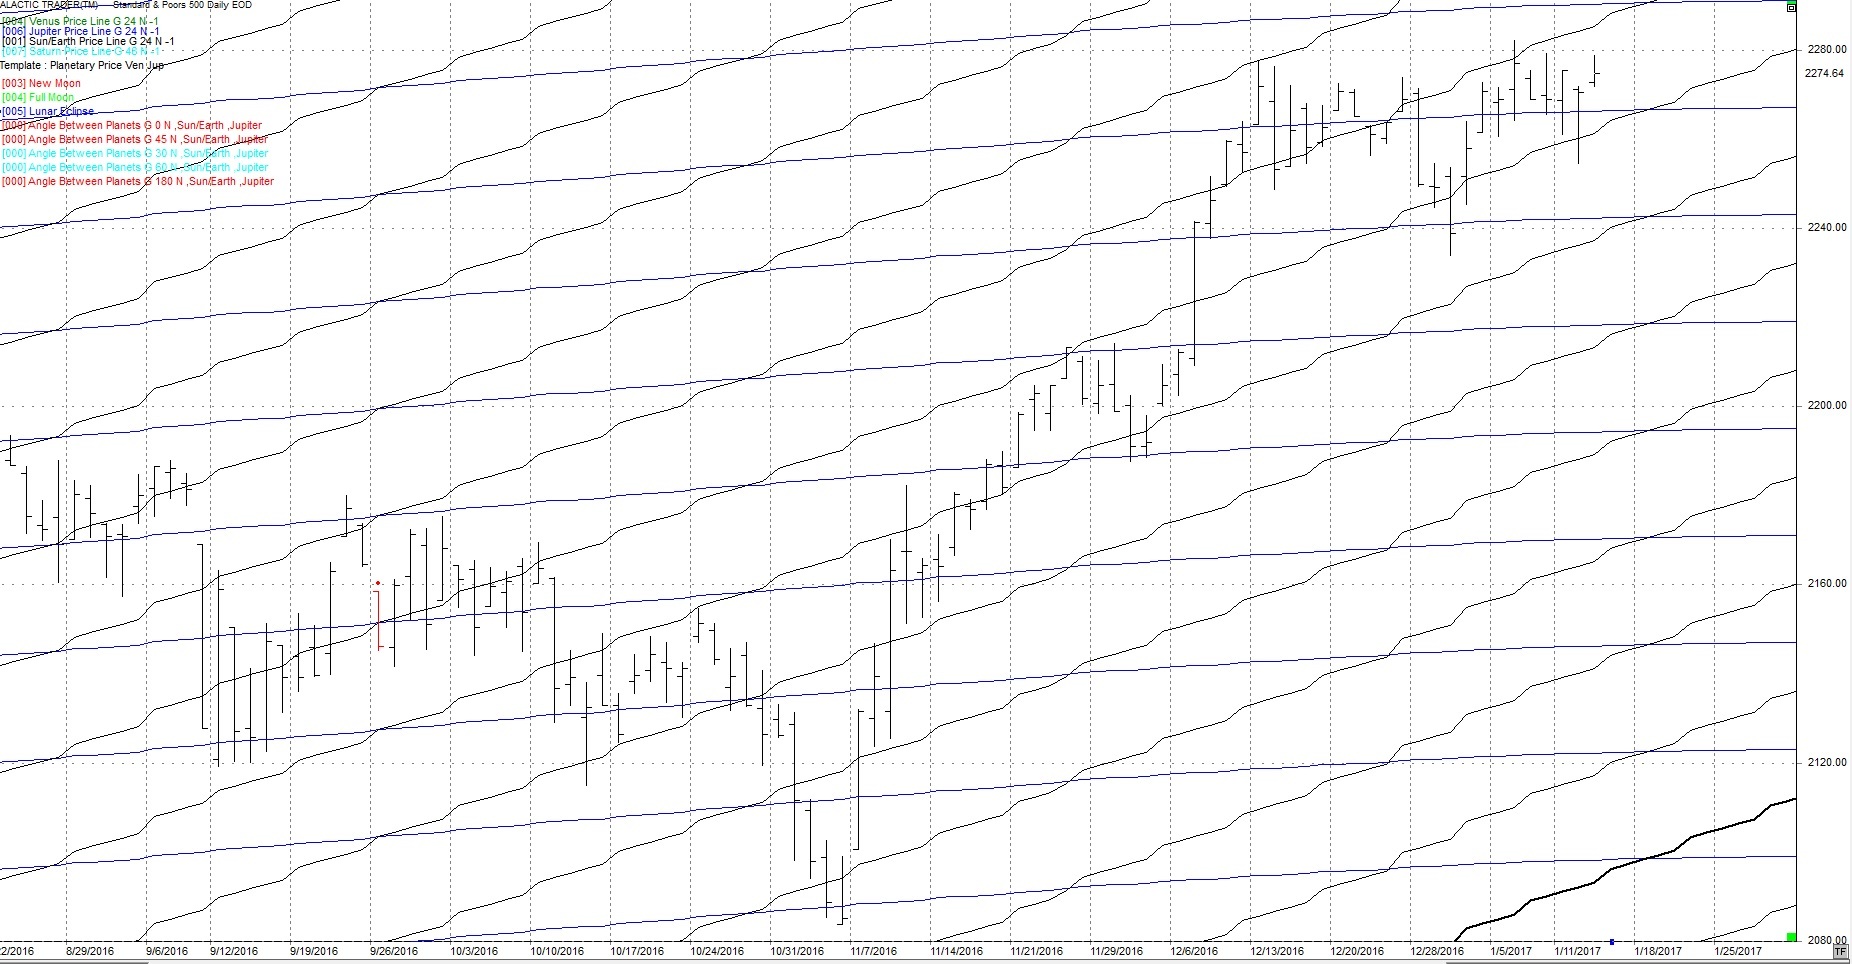
As far as aspects go, the Sun and Jupiter have an affinity for the SP500. The following daily chart of the SP500 shows the Jupiter (blue) price line and the Sun (black) price line. The price line is the longitude of the planets converted to price. On the following chart note the price tends to either reverse or make a sharp move where the Sun price line and Jupiter price line cross. The next date these lines cross is January 18th.
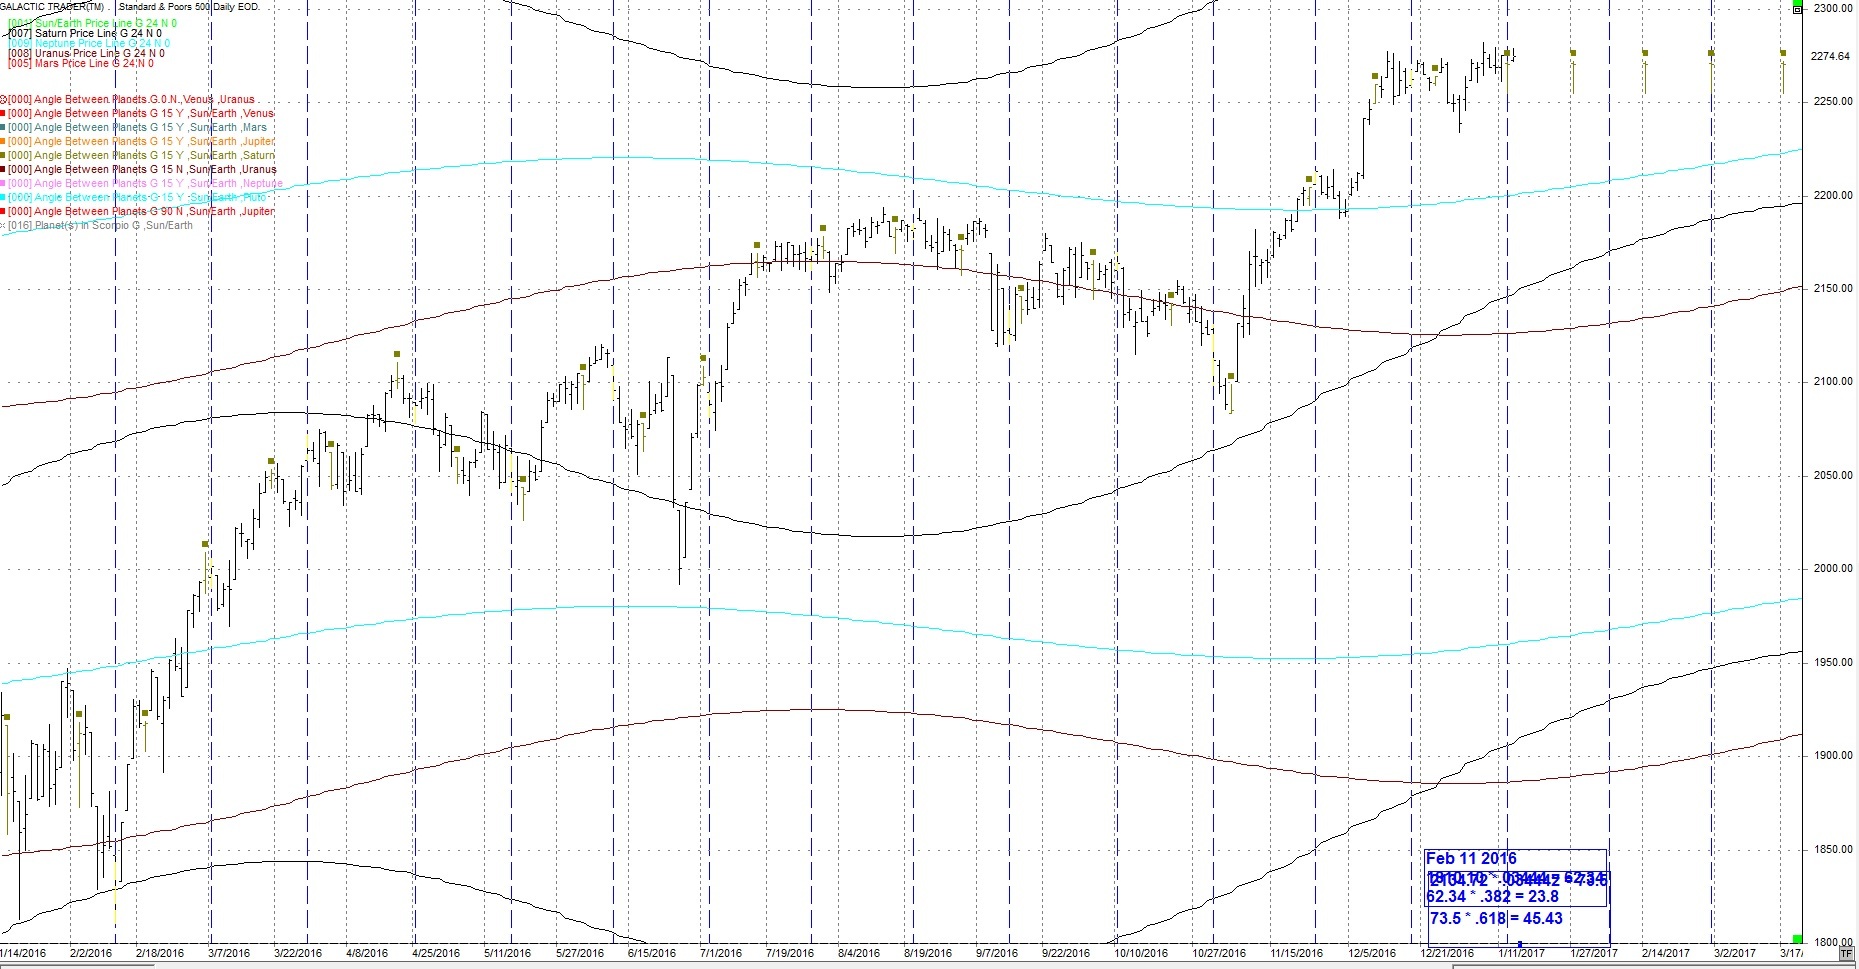
Harmonics
I continue to watch the 24th harmonic cycle (360/24) cycles. The brown squares are Sun/Saturn 15 degrees on the following daily chart.
The next hits are Jan. 27, 2017 then Feb 14, 2017
I have added 3 price lines to this chart.
Saturn - black
Uranus - purple
Neptune - light blue
These price lines can act as support / resistance. Also on this chart is a blue vertical line which is the 24 cd (calendar day) cycle. It has been at highs and lows. The next date is January 12th, that's the same day as the next 24th harmonic for the Sun/Saturn aspect.
Looking forward I'm expecting very difficult markets in the March/April timeframe. In the current time frame I'm looking for a 1/2 Primary cycle crest and volatility caused by both the Jupiter/Uranus opposition being translated by the Sun and Trump's Presidential Inauguration on January 20.
There have been a number of earthquakes over 6.5 the last couple of weeks. I'm expecting more into the New Year. Watch the periods around Feb 10th and Feb 26 for more significant geophysical events.
Author

TradingDaze
Aisys Technologies Inc.
Gordon Lawson, aka TradingDaze, is a Canadian CPA, certified computer programmer and Astrologer. My traditional career spanned 25 years as a Financial Analyst at Suncor and Manager of Information Systems at BP Resources Canada. After this time Mr.


