'SP500 Mid Week ' seems suitable

The next 1/2 year Forecast Dates will be available for purchase in mid-December.(January, 1 2017 - June 30, 2017
Subscribers receive 6 months forecast no matter when they sign up.
SP500
For the SP500, cycle-wise November 4th looks like the Primary cycle trough. 1 which puts us entering the 4th week of a new nominal 18 week cycle. This was quite probably the 40 week cycle trough as well.
The next estimated Primary cycle ( aka nominal 18 week cycle) low is estimated to be March 6th +- 3 weeks with a range of February 13th, 2017 to March 19, 2017. It could also be the week of March 19, 2017 +- 3 weeks. As we get closer I will use the upcoming Astros to try and get a more exact reading on when the Primary cycle trough will occur.
We still have a number of Neptune transits this month. I still expect general confusion into early December.
There is an important aspect, Sun waning square Neptune on November 30, the same day as the OPEC meeting. Also on November 30 there is Mercury quintile (72 degrees or 1/5 of a circle) Neptune and December 1 Mars waxing trine Jupiter.
Jupiter and Neptune are the co-rulers of crude. At this time Neptune is in Pisces, the sign that it rules, making Neptune more powerful at this time. This OPEC meeting is important to get a direction for crude early in Trumps term since he is on record as wanting to build up US based energy producers.
The Jupiter / Pluto square on November 24th then Venus aspecting both Jupiter and Pluto on November 25th didn't have much effect. I was looking for a change in trend in the general markets. This would have to happen early next week.
Following is a daily chart of the SP500. The brown line is an adjusted Bradley indicator. It's purpose is to find a change in trend. This is not straight forward to read and the details with video are in section 9 of the subscribers report.
Following is our normal daily chart for the SP500. Price is now above both the 15 and 45 day sma's. and the 15 day sma is above the 45 day. They both turned up. A usual setup leading out of a Primary cycle low.
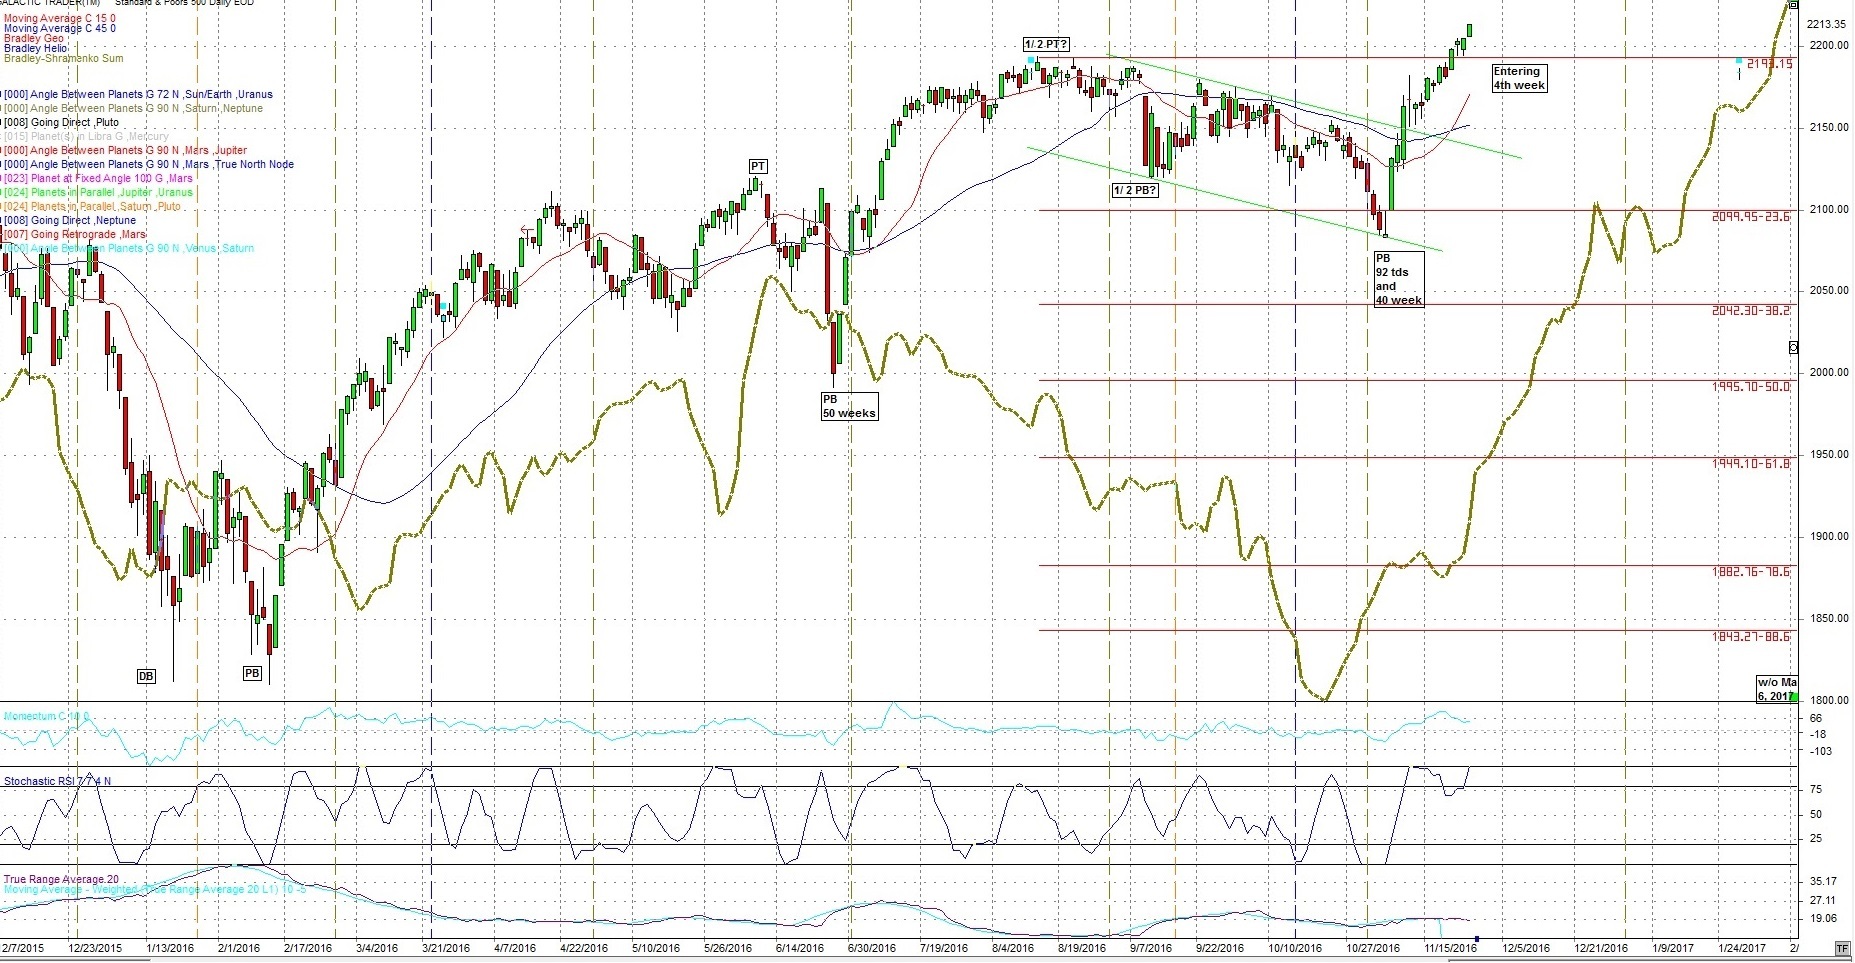
Note, on the above chart the adjusted Bradley (brown line) is turned on November 18th. This did not mark a change in trend. For those who have been reading this blog for awhile I have noted there is often a pullback 2 to 4 weeks after a Primary cycle low. So in this case 2 to 4 weeks after November 4th. We are entering the 4th week. This is based on starting the Primary cycle with a 6 week cycle. The other option is the first sub-cycle of the Primary cycle is the 1/2 Primary or 9 week cycle.
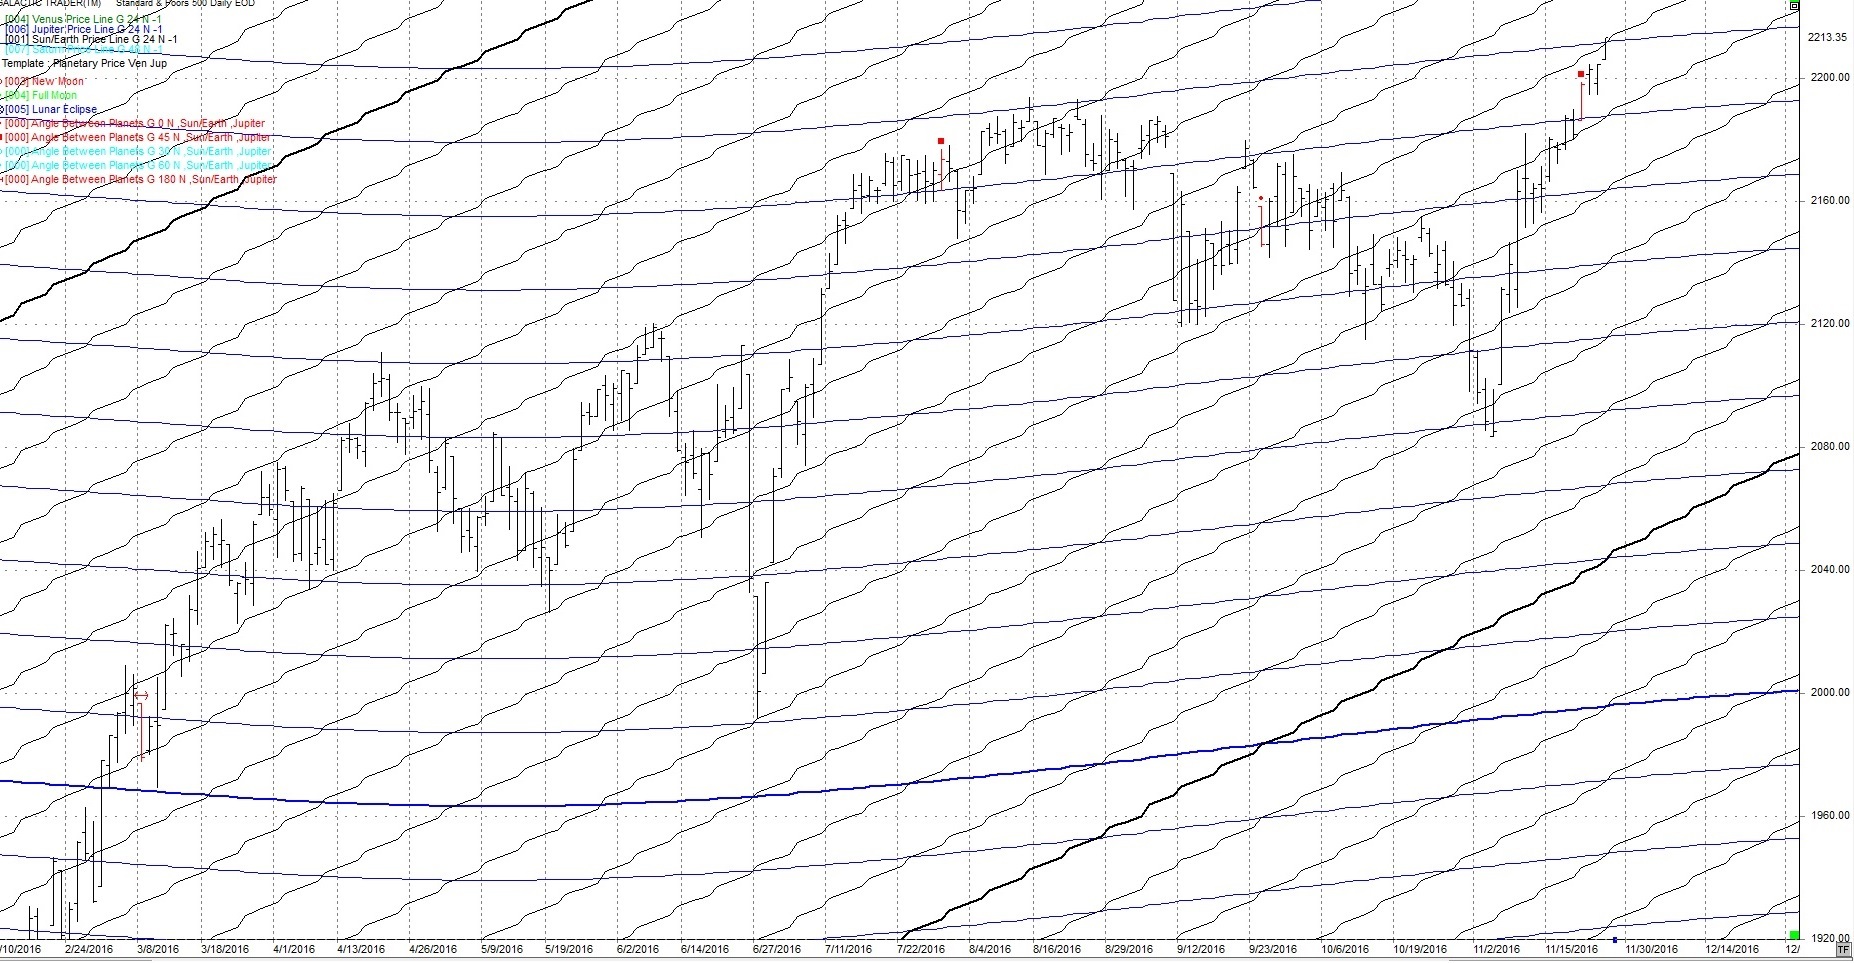
As far as aspects go, the Sun and Jupiter have an affinity for the SP500. The following daily chart of the SP500 shows the Jupiter (blue) price line and the Sun (black) price line. The price line is the longitude of the planets converted to price. On the following chart note the price tends to either reverse or make a sharp move where the Sun price line and Jupiter price line cross. Note the last price bar on this chart is on one of these crossings. I'm looking for a reversal or sharp move up or down early next week.
Harmonics
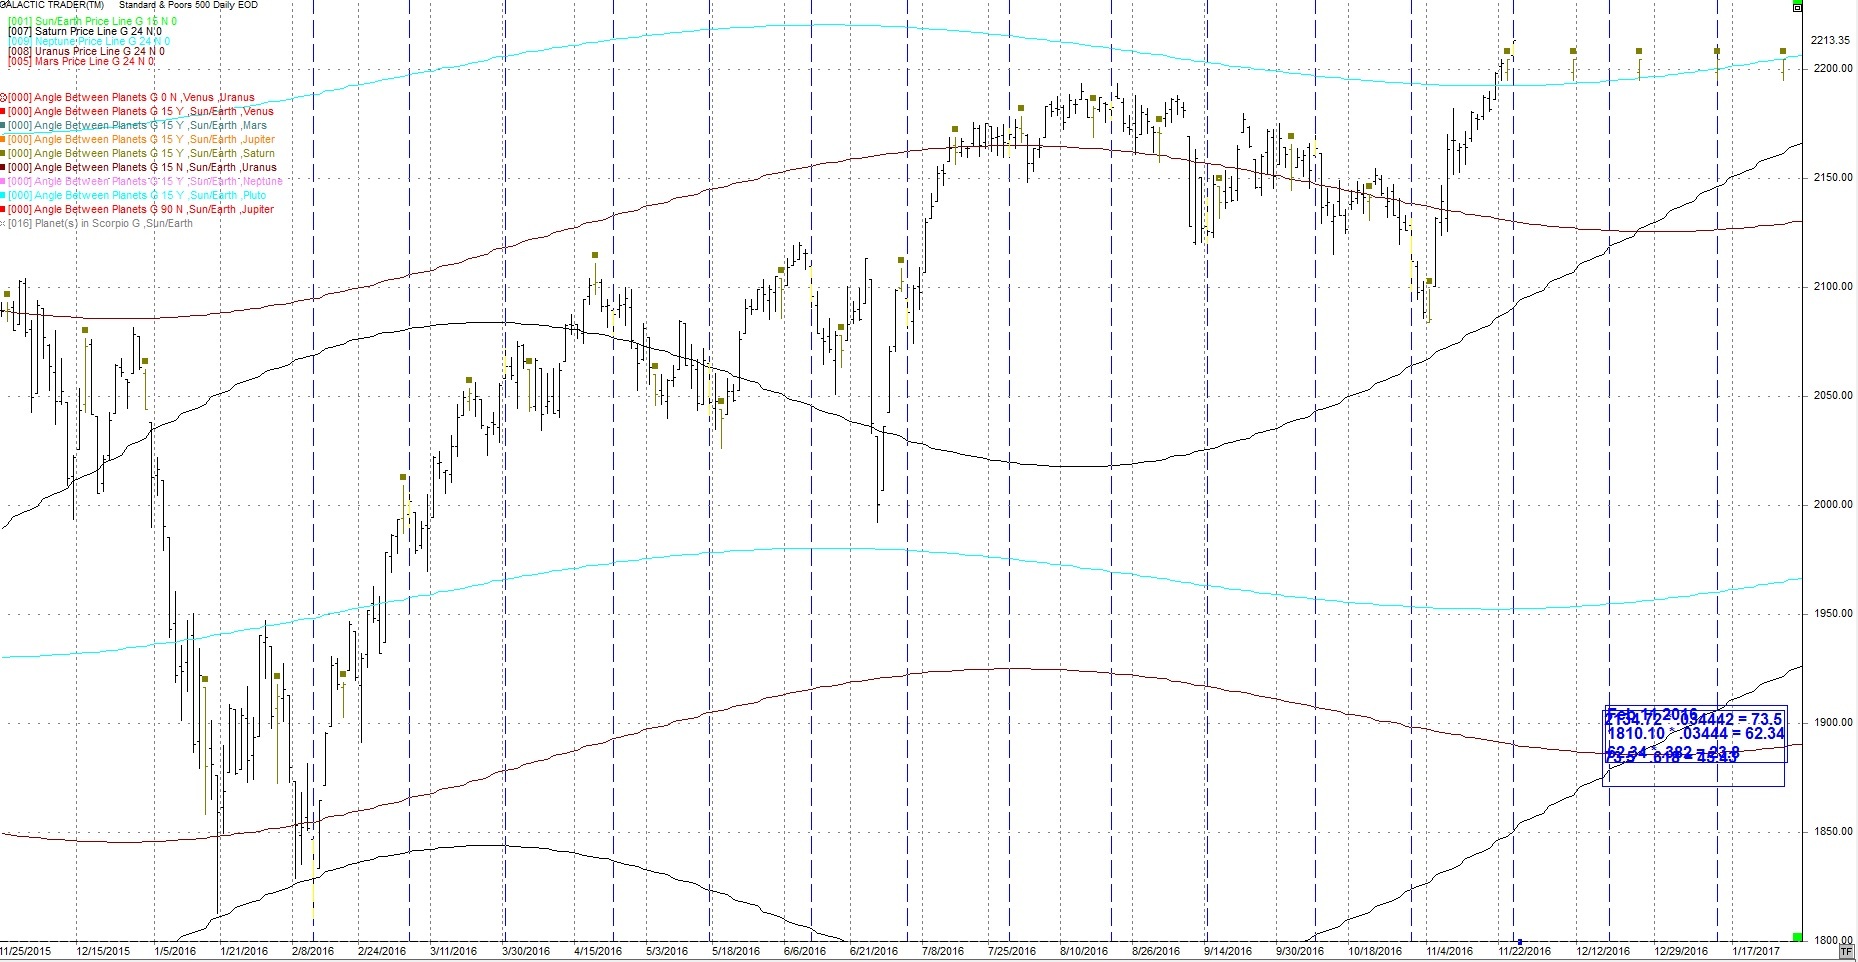
I continue to watch the 24th harmonic cycle (360/24) cycles. The brown squares are Sun / Saturn 15 degrees on the following daily chart. The last hit was
November 4th, the day of the cycle troughs we have been following. The next hits are then Nov. 23rd and Dec. 9th. They are often at short changes in trend.
I have added 3 price lines to this chart.
Saturn - black
Uranus - purple
Neptune - light blue
These price lines can act as support / resistance. Notice we have just broken through the Neptune price line. Give these a couple of days.
Also on this chart is a blue vertical line which is the 24 cd (calendar day) cycle. It has been at highs and lows. We just hit it today, November 25th.
There have been a number of earthquakes over 6.5 this week. I'm expecting more possiblt closer to the end of December.
"Everybody knows that the boat is leaking
Everybody knows that the captain lied
Everybody got this broken feeling
Like their father or their dog just died
Everybody knows"
-- Leonard Cohen
Author

TradingDaze
Aisys Technologies Inc.
Gordon Lawson, aka TradingDaze, is a Canadian CPA, certified computer programmer and Astrologer. My traditional career spanned 25 years as a Financial Analyst at Suncor and Manager of Information Systems at BP Resources Canada. After this time Mr.


