SP500 Looking for Volatility

The next 1/2 year Forecast Dates are available for purchase.
(January, 1 2017 - June 30, 2017
Subscribers receive 6 months forecast no matter when they sign up.
SP500
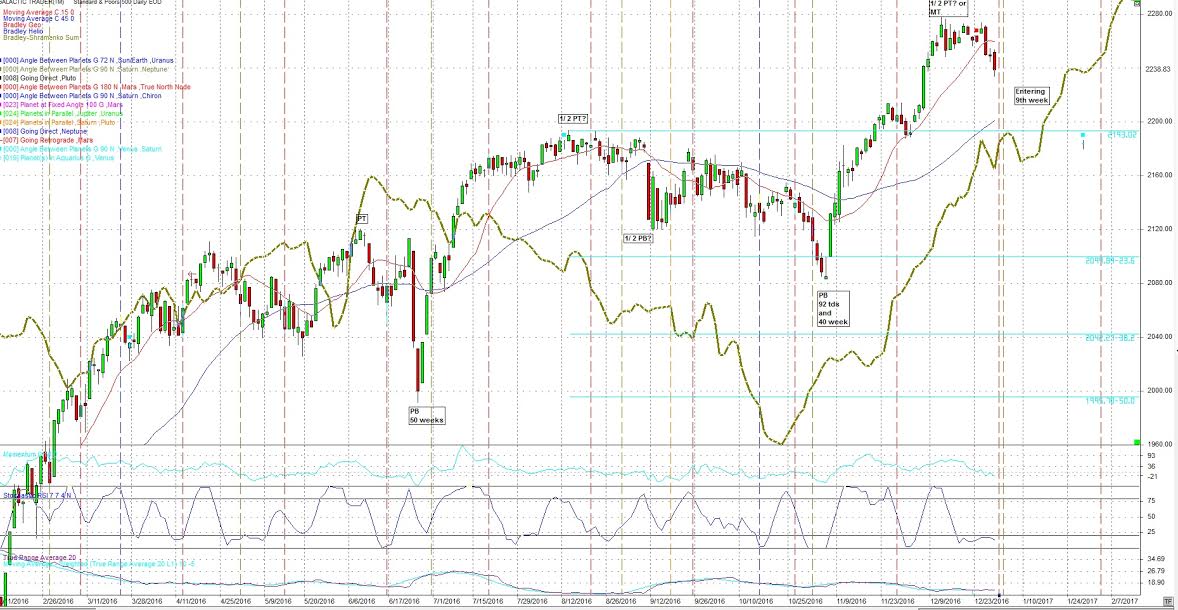
For the SP500, cycle-wise November 4th was the Primary cycle trough. 1 which puts us entering the 9th week of a nominal 18 week cycle. Nov. 4th was the 40 week cycle trough as well. We could be looking at a 1/2 Primary cycle crest and then down. I like the Jan 10th date +- a few. A point. If we get a low on Jan 10-12 then we should review the 1st half year forecast dates and take out anything close to the January 10 date. In this case I would not expect the Mars square Saturn to mark a low if the Jan 10-12 dates registered a low. The 1st Half 2017 Forecast dates are estimated from Astrological events only. As time unfolds we have the benefit of market cycles and possibly additional Astrological events. Nevertheless the original dates have fared very well. See the blog podt s couple of weeks ago showing the original forecast dates for the SP500. These are the original 6 month dates with no adjustments.
It should be noted Primary cycles (18 weeks) most often start with a 6 week sub-cycle. We are there. The 2nd most common start is a 1/2 Primary or 9 week sub-cycles. This now looks like a 1/2 Primary cycle.
The next estimated Primary cycle ( aka nominal 18 week cycle) low is estimated to be March 6th +- 3 weeks with a range of February 13th, 2017 to March 19, 2017. It could also be the week of March 19, 2017 +- 3 weeks. As we get closer I will use the upcoming Astros and market cycles to try and get a more exact reading on when the Primary cycle trough will occur. Early April is another possibility.
December 12 had the Sun trine Uranus. This is always approx. 17 cd's (calendar days) before the Uranus Direct signature and 12 cd's after Uranus Direct is the Sun square Uranus on January 10, 2017. This is a Uranian time between Dec 12 and Jan 10th. Uranus can indicate the outbreak of political tension, rioting, right-wing political ideas, free market enterprises, airplanes, breakthroughs, surprise discoveries, explosions, demonstrations, retaliation, advanced technologies and surprises in many areas of life.
On January 1st we have Mars conjunct Neptune. This is a signature of rejection, denial, destruction and infection. It can manifest as illness or failures caused by an absence of plans. This could be pointing to violence on New Years Eve. This is a possible terrorist signature or some type of poisoning or gas.
If there is no serious violence over the holidays I expect a short rally to start January 3rd then down into a low near January 10th +- 2 td's. That's the day for the Sun square Uranus mentioned above. We should be going down, and it may be fairly sharp into a 1/2 Primary cycle. This is also just 2 td's away from Mercury turning Direct.
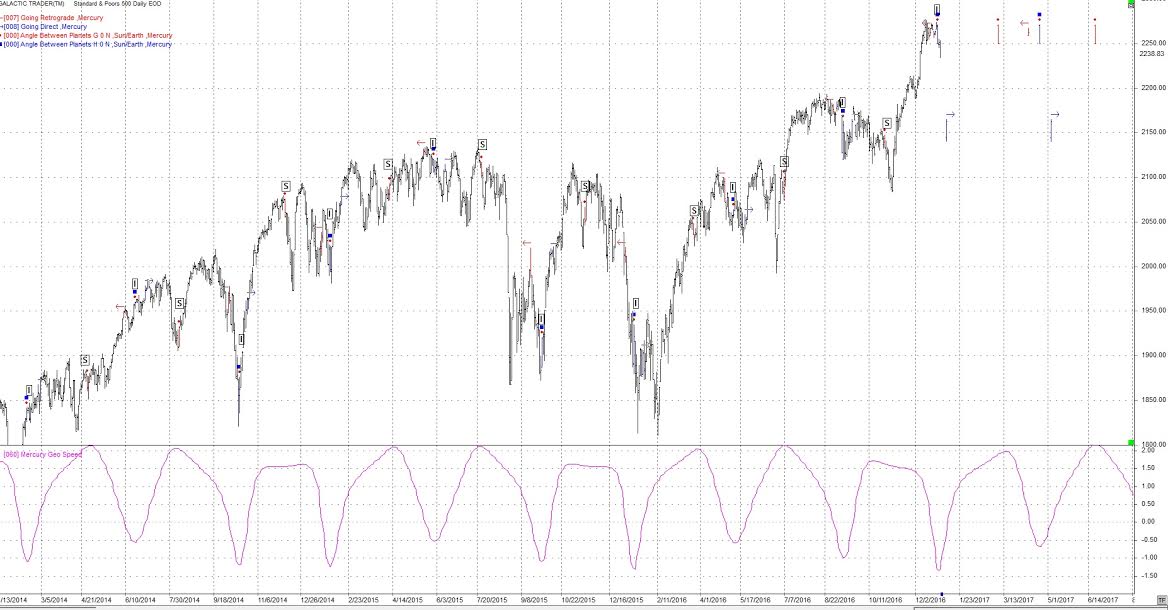
We are in the middle of the Mercury retrograde period with the Inferior conjunction on December 28th.. The Mercury Retrograde period will last until Mercury turns Direct on January 8, 2017.
Following is a daily chart of the SP500 with the Mercury retrograde (red arrow pointed left) and Mercury direct (blue arrow pointed right). This chart also shows the Superior and Inferior conjunctions. The inferior conjunction is often a short term pull back which we have now.
December 26 when the US markets were closed for Christmas there is a 14 year aspect, Jupiter opposing Uranus. This is the first of a 3-pass with 2 oppositions in 2017. At times this opposition will be a T-square with Pluto at the Apex. The French Astrologer, Barbault considers this transit to be predominantly a capitalist oriented cycle. This transit could bring a spirit of collective optimism. Look for progress as this aspect encourages and a perception of deeper potentialities, poses questions and opens up opportunities. This may be particularly opportune at this time with "The Donald" looking to improve the capitalist system which is the USA. Don't look for an immediate event. Look for a swing to the right politically. Revolutionary activity. This aspect has a history of turns. This aspect along with the Mercury Inferior conjunction on Dec 8th may have started the turn down. The Jupiter / Uranus opposition is still in orb. The Sun will be translating this aspect on January 10th and January 11th. See last month for definitions.
In addition to this transit Mars will make a number of transits over the holiday period. This could be pointing to a violent period with possibly increased terrorist activity.
The other long term aspect is Saturn trine Uranus, a 45 year aspect. We will cover this important transit in the subscriber report. For our purposes here we will say it has a history in the middle east.
Following is a daily chart of the SP500. The brown line is an adjusted Bradley indicator. It's purpose is to find a change in trend. This is not straight forward to read and the details with video are in section 9 of the subscribers report. Price is now above both the 15 and 45 day sma's. and the 15 day sma is above the 45 day. They both turned up. but now price is turning down and the 15 day sma is curling over.
The January 2017 subscribers report will outline some longer term Astrological aspects and events.
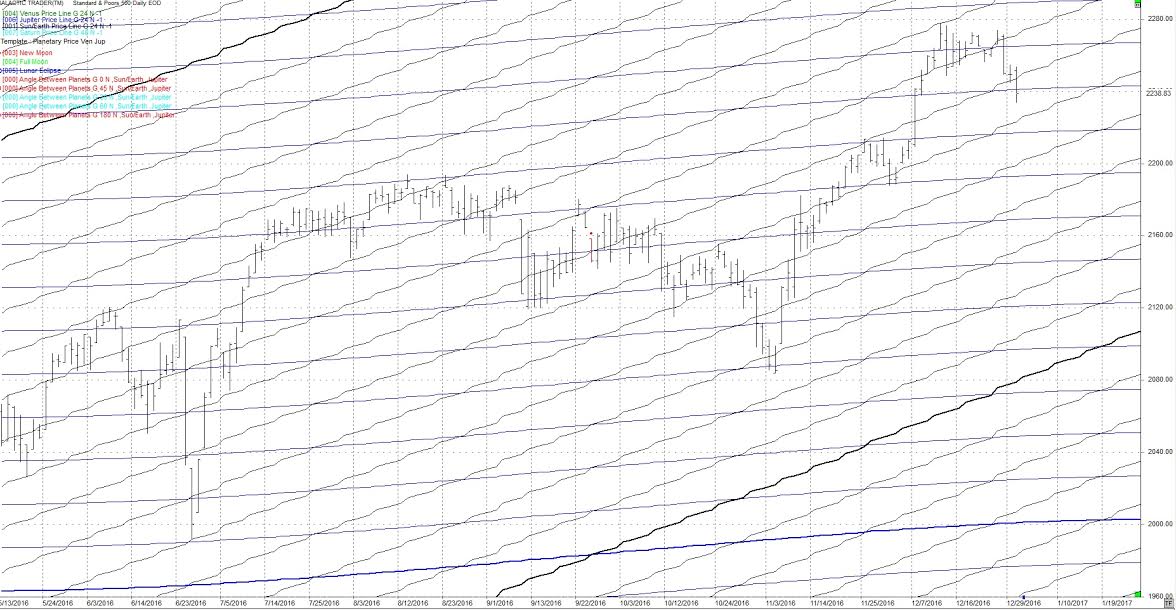
As far as aspects go, the Sun and Jupiter have an affinity for the SP500. The following daily chart of the SP500 shows the Jupiter (blue) price line and the Sun (black) price line. The price line is the longitude of the planets converted to price. On the following chart note the price tends to either reverse or make a sharp move where the Sun price line and Jupiter price line cross.
Harmonics
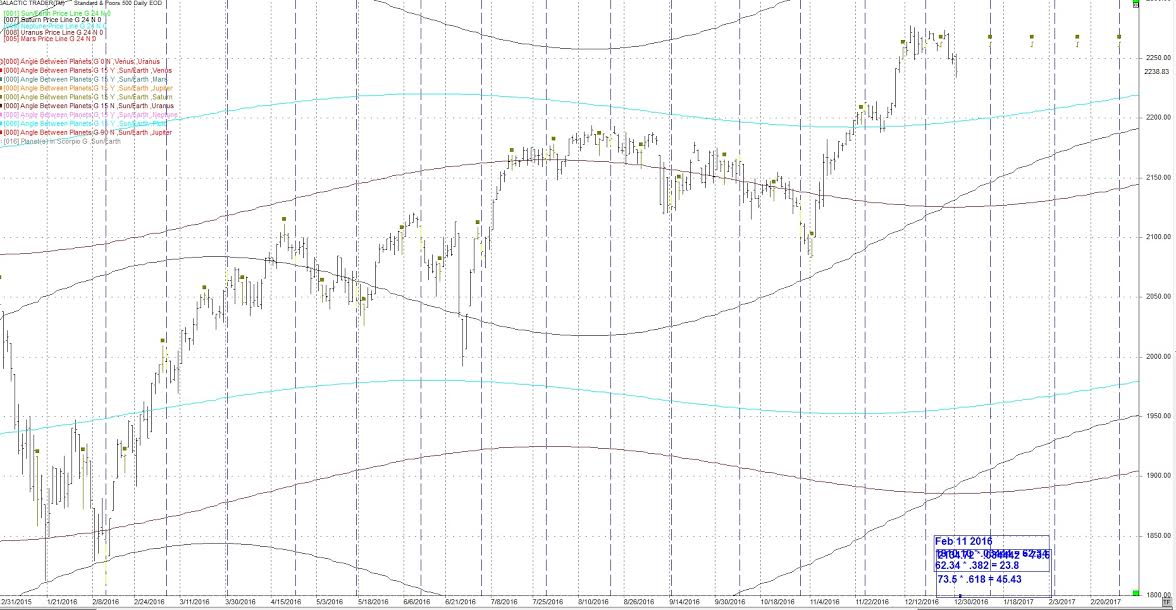
I continue to watch the 24th harmonic cycle (360 / 24) cycles. The brown squares are Sun / Saturn 15 degrees on the following daily chart.
The next hits are Jan 12, 2017 then Jan. 27, 2017.
I have added 3 price lines to this chart.
Saturn - black
Uranus - purple
Neptune - light blue
These price lines can act as support / resistance. Also on this chart is a blue vertical line which is the 24 cd (calendar day) cycle. It has been at highs and lows. The next date is January 12th, that's the same day as the next 24th harmonic for the Sun/Saturn aspect. Again Jan 12 is close to the Jan 10th date a potential low.
There have been a number of earthquakes over 6.5 the last couple of weeks. I'm expecting more into the New Year.
There may also be problems in the mid-East in the New Year. Look to Israel and Egypt. Problems involving Israel may stretch into March 2017.
Author

TradingDaze
Aisys Technologies Inc.
Gordon Lawson, aka TradingDaze, is a Canadian CPA, certified computer programmer and Astrologer. My traditional career spanned 25 years as a Financial Analyst at Suncor and Manager of Information Systems at BP Resources Canada. After this time Mr.


