SP500 Looking for a Pullback

SP500
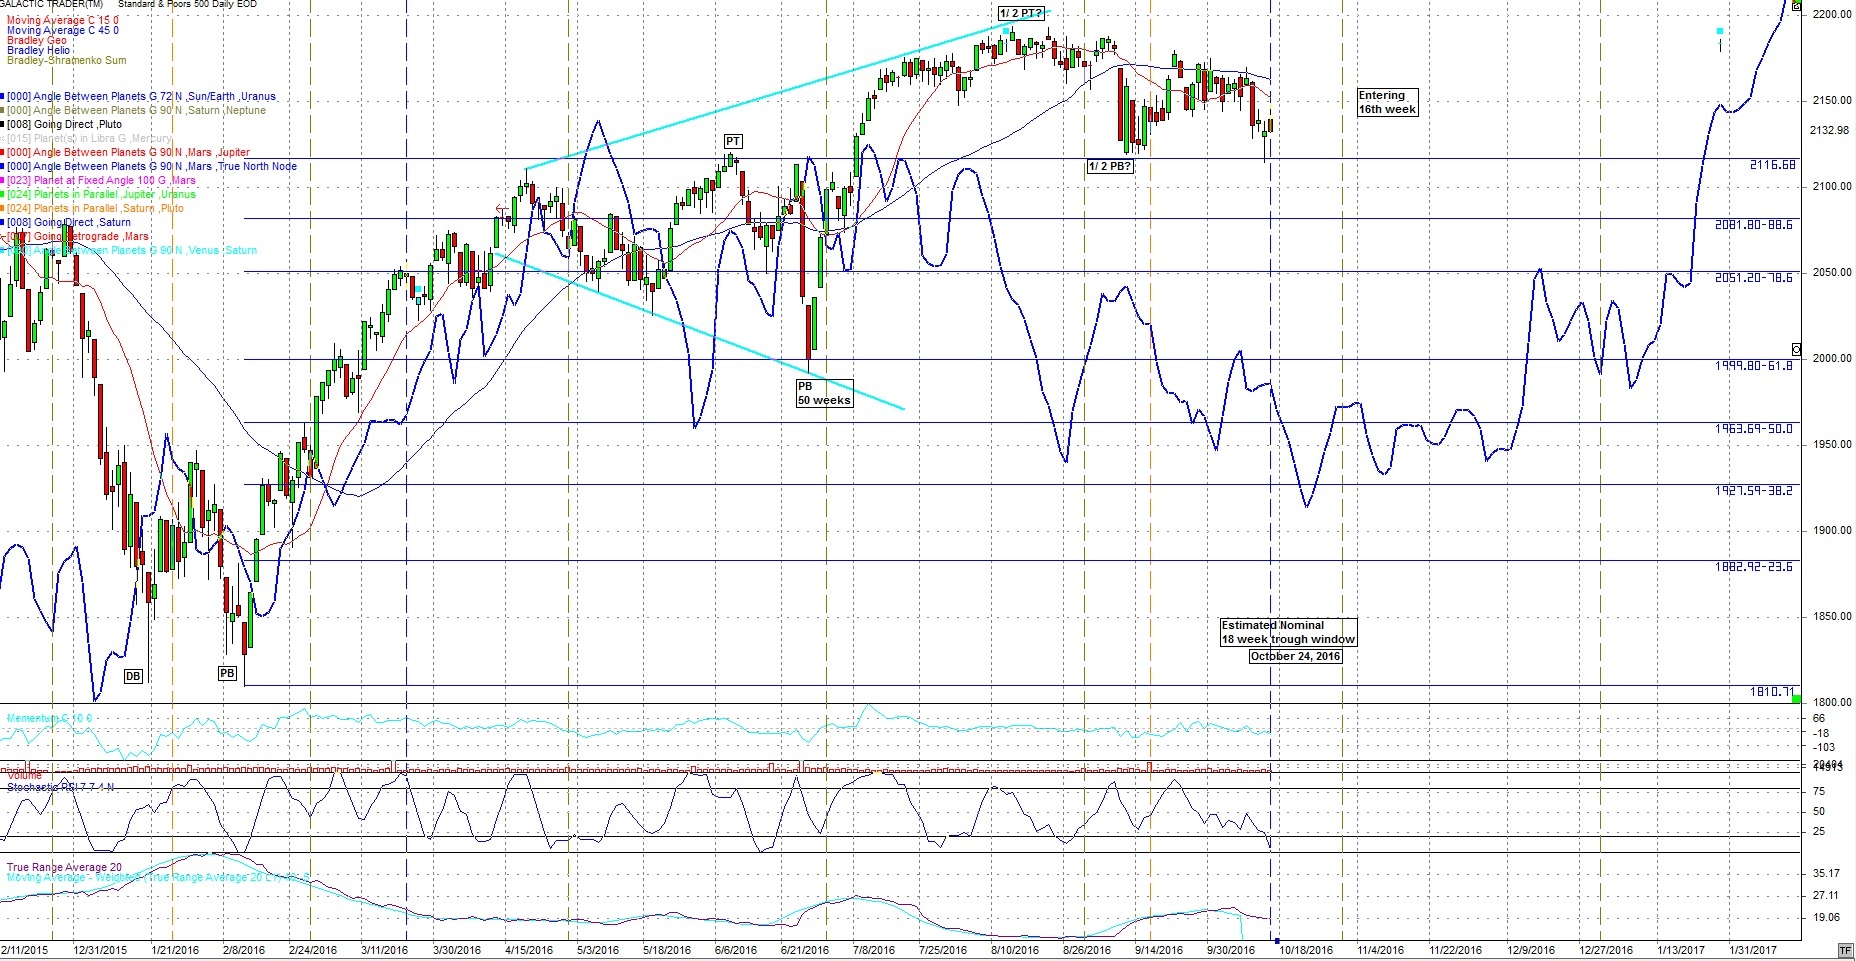
For the SP500, cycle-wise June 27 was the last Primary cycle trough. 1 that puts us entering the 16th week. I was looking for a possible 50 week low to coincide with that June 27th Primary trough. The sharp move up after the June 27th Primary low seems to confirm this was the 50 week trough as well.
The next estimated Primary cycle (aka nominal 18 week cycle) low is estimated to be October 24 +- 3 weeks with a range of October 3rd to November 14th. As we get closer I use the upcoming Astros to try and get a more exact reading on when the Primary cycle trough will occur. There are 2 areas where the Astrological aspects have a history of Primary cycle turns, in this case a trough. These are included in the October Subscribers report. I've mentioned Election day, October 8th as a possible low but now wondering if this marks the start of a more severe slide.
With the USA elections, this Primary cycle may extend to be close to the election date, November 8th. For those who have been reading this blog for awhile I've been looking for some large deceit or lies being exposed. This maybe what is coming out of Wiki leaks and Assange but it hasn't made it to the Main Stream Media
One area of note. Saturn will be at 14 degrees, 41 minutes in Sagittarius on November 3rd. This is conjunct the Fixed Star Sarin. Fixed Stars are treated as if they stand still. They do move but very slowly. Saturn moves slowly as well. It takes approx. 29 years for one trip around the Sun. The last time Saturn was in this position was September 5, 1987. A few days before the market crash of '87. This is far from definite but look for a possible severe move down around November 3rd - 8th or shortly thereafter. We'll know better as we get closer in time.
In mundane astrology the star names can also be significant. On March 20, 1995 there was a sarin attack on the Tokyo subway, killing at least a dozen people, severely injuring fifty and causing temporary vision problems for nearly a thousand others. Transiting Jupiter was conjunct this fixed star Sarin. Note I am not forecasting the same event.
Mars entered Capricorn on Sept 27th where it is exalted. One more piece of a move from mutable signs to Cardinal signs. Here Mars, male energy, is the initiator of action in the worldly environment and is kept in check by Saturn the ruler of Capricorn. Mars leaves Capricorn and enters Aquarius on November 9th, the day after the US Election.
Before the US Election there are a number of other Astrological transits and events like a perigee Full Moon, aka Supermoon this week and a very strong Astrological aspect this week.
There have been a number of Heliocentric Astrological last week and now we have the Sun opposing Uranus. This may cause increased geophysical disturbances, including earthquakes and volcano's.
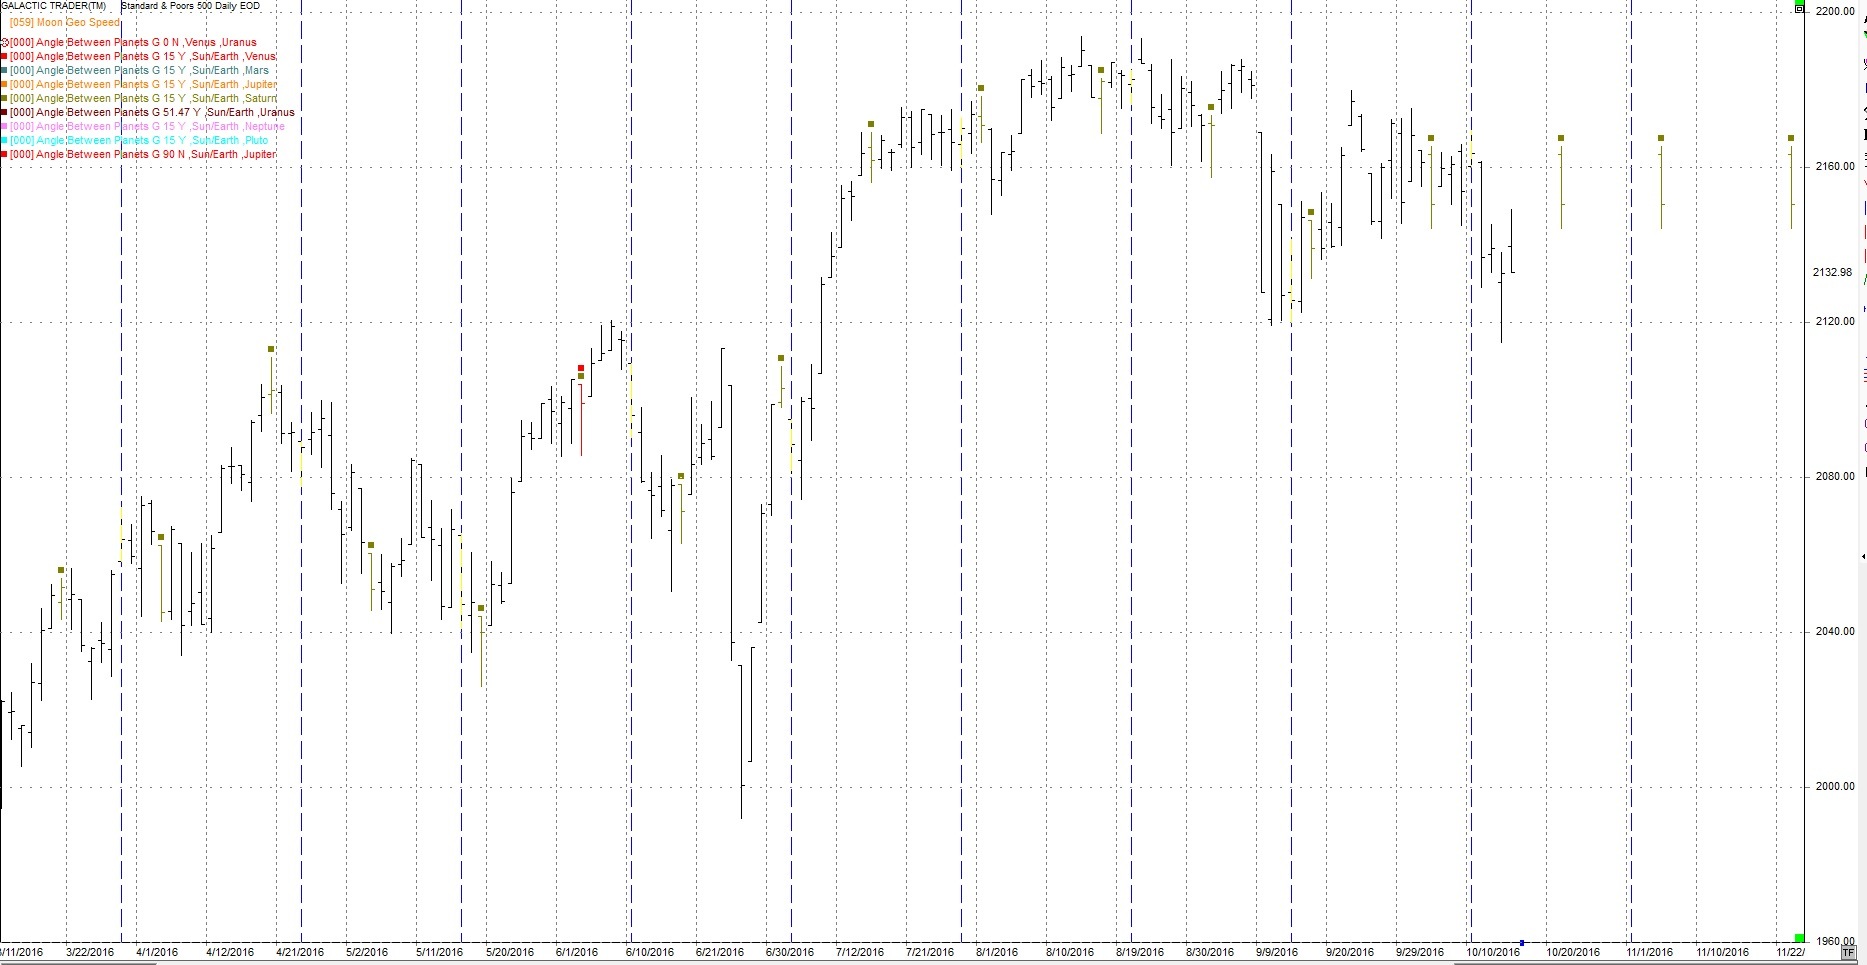
Following is a daily chart of the SP500. The blue line is the heliocentric Bradley indicator. It's purpose is to find a change in trend. This is not straight forward to read and the details with video are in section 9 of the subscribers report.
Note the next V shaped bottom of that indicator is right on October 24th, 2016. It has no polarity by itself. This suggests there will be a move but not the direction of the move.
Following is a chart of the planetary average longitude. The horizontal blue lines are based on the average longitude of the planets Jupiter, Saturn, Uranus, Neptune and Pluto which are converted to price. The levels this calculates typically are excellent points to place sell or buy stops. I often use them with Fibonacci retracement levels as well. Price went up Oct 14 and just touched the 2151 line (blue) and fell back intra day to close at the low of the day.
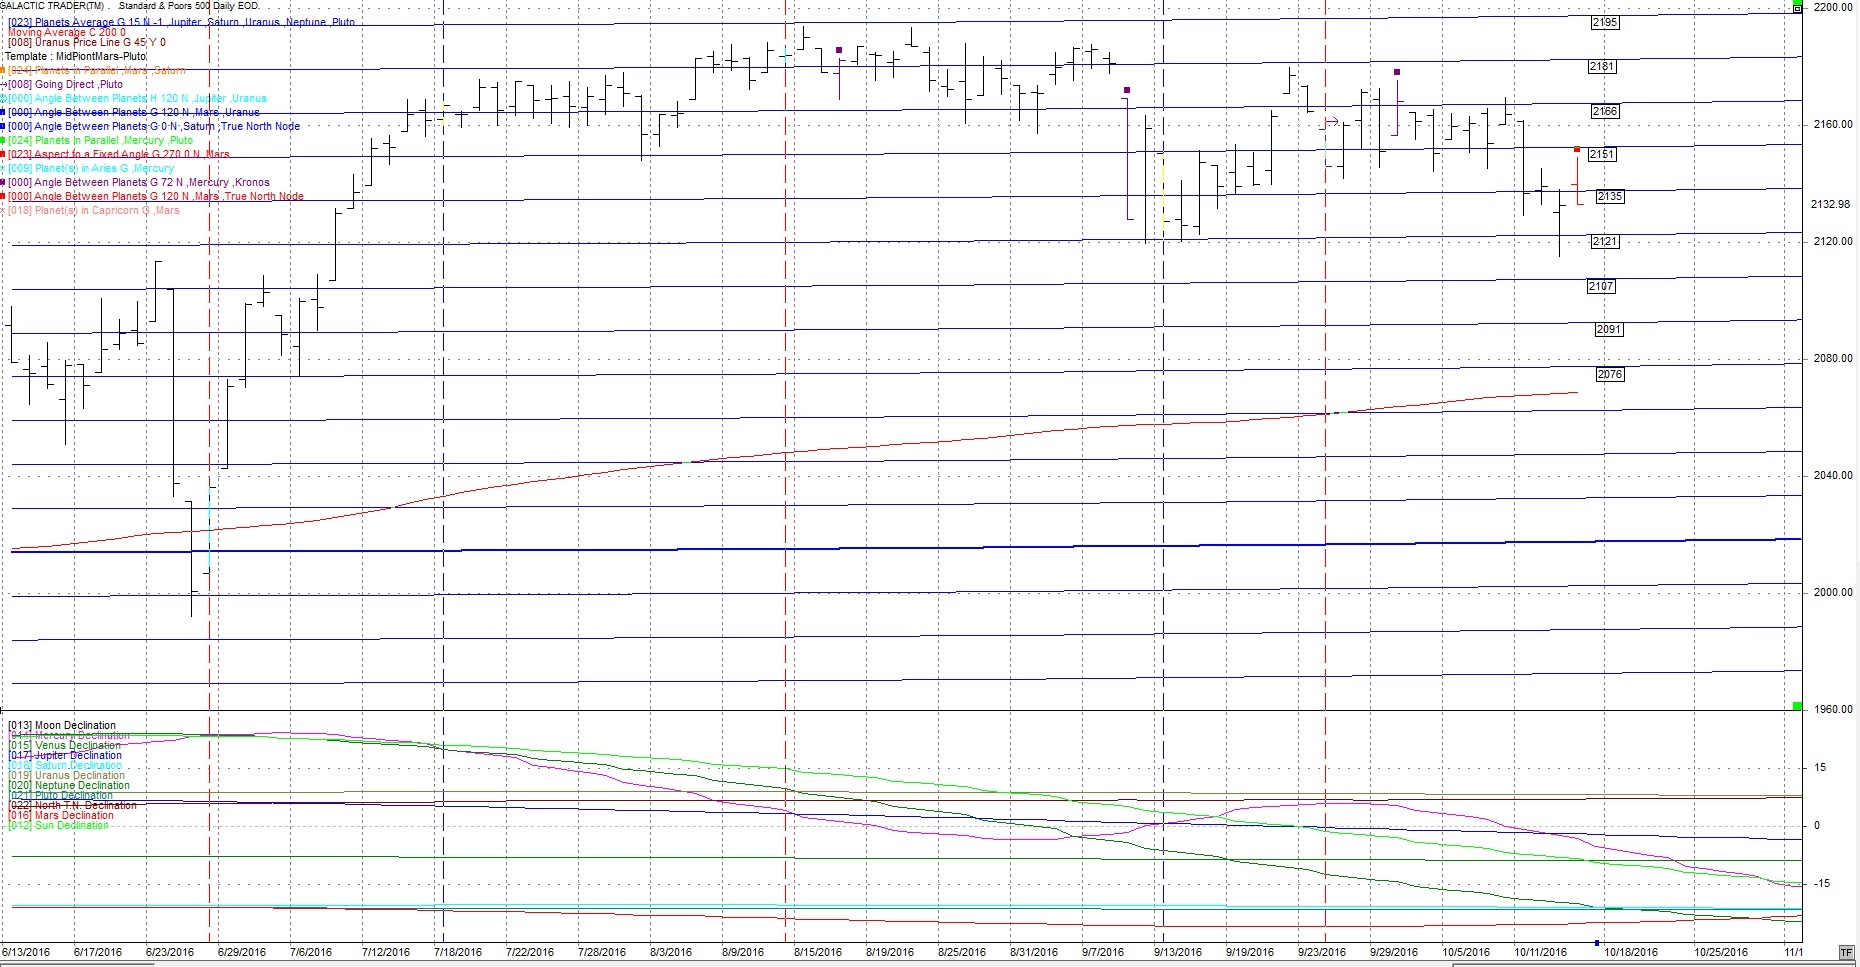
Other transits over the next couple of weeks point to a volatile period in the markets.
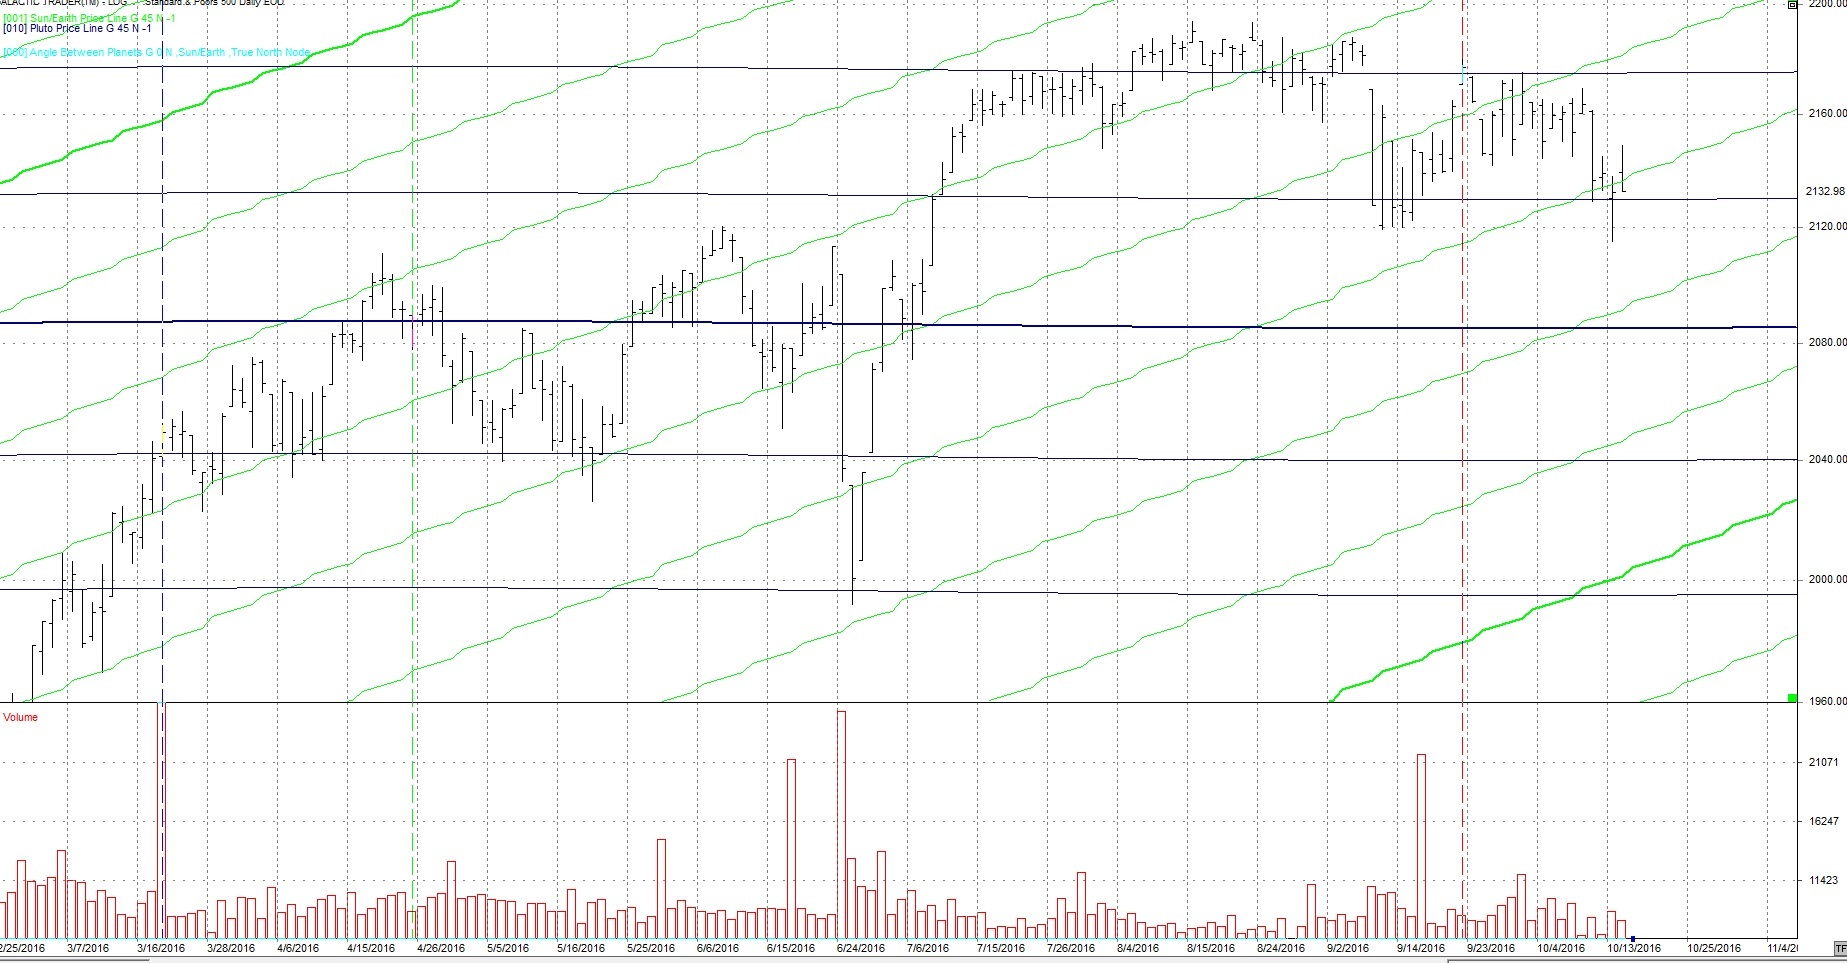
Another chart is the daily SP500 with the Sun and Pluto price lines. Green is the Sun and black is Pluto. Notice, the SP500 was stopped at the Sun price line (green line) during the day and fell back close to the Sun price line at the close. The previous day price peaked below the Pluto line (black) but closed over the Pluto line. Watch this early next week to see if either the Sun or Pluto will provide support or resistance.
Harmonics
I continue to watch the 24th harmonic cycle (360 / 24) cycle between the Sun and Saturn, which are the brown squares on the following daily chart. The next hits are Oct. 21st then November 4th. They are often at short changes in trend as seen on the August 1 date which was followed by two strong moves down.
"What everyone is looking for, is what is looking."
-- St. Francis of Assisi
Author

TradingDaze
Aisys Technologies Inc.
Gordon Lawson, aka TradingDaze, is a Canadian CPA, certified computer programmer and Astrologer. My traditional career spanned 25 years as a Financial Analyst at Suncor and Manager of Information Systems at BP Resources Canada. After this time Mr.


