SP500 Down into Mid May

SP500
For the SP500, cycle-wise I’m looking at March 27th as the Primary cycle trough and April 13th as a double bottom.
This puts us entering the 7th week of a new Primary cycle. We should therefore be looking for a pull back into the first nominal 6 week cycle trough. The other possibility would be a ½ Primary cycle (9 week) which would be a couple of weeks out.
We had a descending triangle (green) on the chart. As often happens price crashed through the upper line of the triangle, in effect gapping twice. Those gap areas may act as support.
It should be noted Primary cycles (18 weeks) most often start with a nominal 6 week sub-cycle. The 2nd most common start is a 1/2 Primary or 9 week sub-cycles. The nominal range for the Primary cycle is 13 to 21 weeks. The recent highs were on March 1st closing at 2,396 in the SP500 then a high om May 9th at 2,403.87, a new All Time High.
To summarize, I’m looking for a pullback in the short term to a nominal 6 week or ½ Primary cycle trough. I’m expecting volatility with both ups and downs but moving forward I’m looking for a low probably mid-June after reviewing the Astrological aspects.
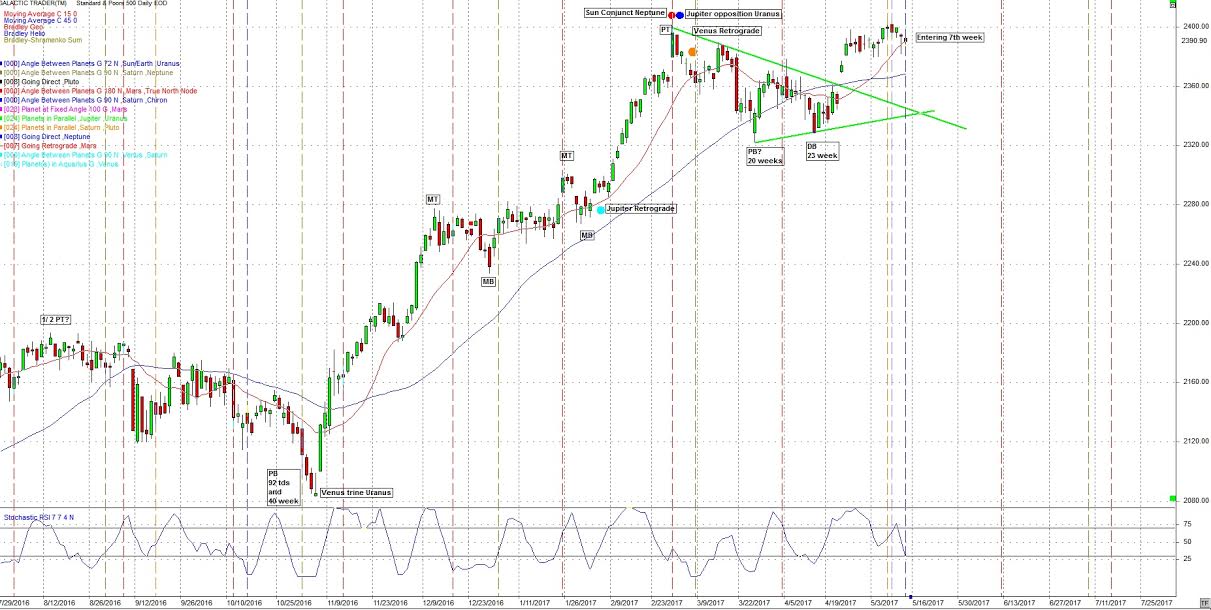
Note the 15 (red) and 45 day (blue) sma’s. Price dropped below the 15 and 45 day sma’s on March 27 then again in mid-April.
This coming week has some powerful aspects, see below.
One we haven’t shown for some time is the Full moon to New moon. As noted on the chart:
buy 3 days before the Full Moon
Sell 3 days after the New Moon
This is not 100%. I’ve found it works best in a non-trending, sideways market.
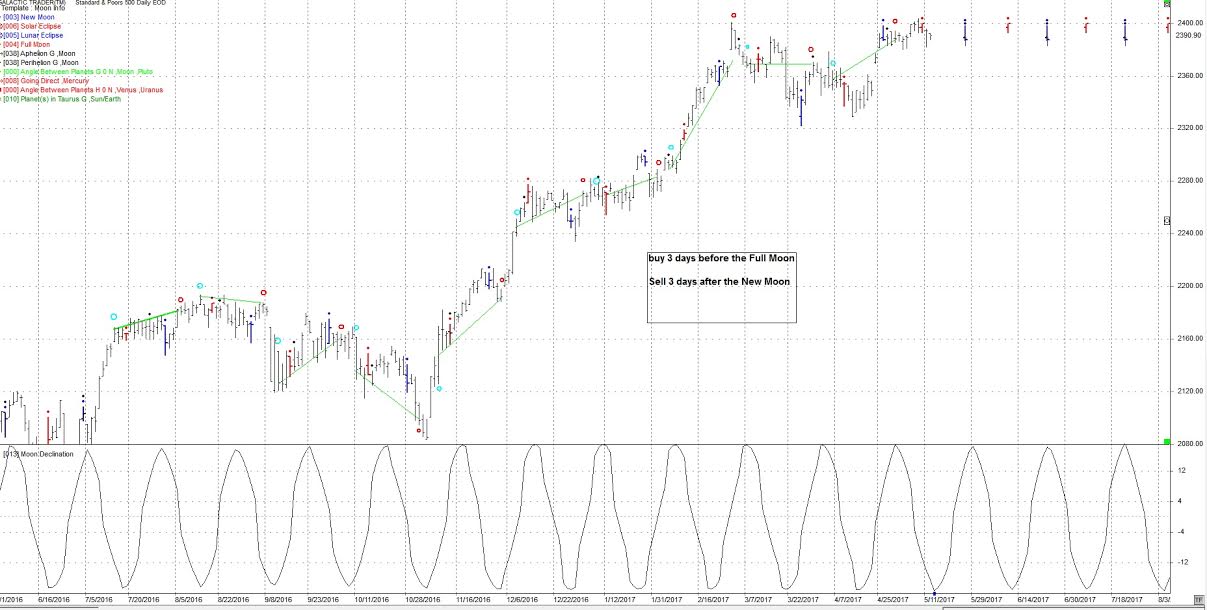
Another cycle that has been at highs and lows is the 40 trading day cycle *td). Next due May 24th +- 3 tds.
Other Astros coming up this week are:
May 15 North Node on the position of the August 21 Solar Eclpise
Watch for events that could lead to open hostilities or a strong geophysical event.
May 18 Venus Shadow Date
This is the day Venus returns to the position it help when it went retrograde.
This often marks a change in trend.
May 19 Saturn waning trine Uranus
This is the 45 year transit mentioned a number of times with more details sent to subscribers. This is a 3 pass and this is the middle aspect.
Saturn / Uranus contacts emphasize the politics of order and are basically conservative and authoritarian.
This covers the flow of investment and production in heavy industry. Note, what Trump is attempting in the USA.
This is an aspect to bring out new ideas, inventions, insights and reforms.
This aspect can also manifest as sudden breakdown of existing structures.
In this day and age sudden internet attacks change the status quo.
This aspect also has a strong connection with the Middle East and Israel and gypt in particular. When looking at Brexit and recent political actions in the USA with the Trump presidency look no further than the Saturn / Uranus trine.
Being a 45 year event it needs a wide orb, 2-3 months. I’ll watch other aspects to both Saturn and Uranus as possible triggers.
May 19 Venus opposition Jupiter
Same day as the 45 year event above. If the markets are still going up then this should be a good opportunity to short within 4 -5 days.
May 21 Mercury Shadow Date
Same as Venus, it is the day Mercury returns to the position it held when it went retrograde.
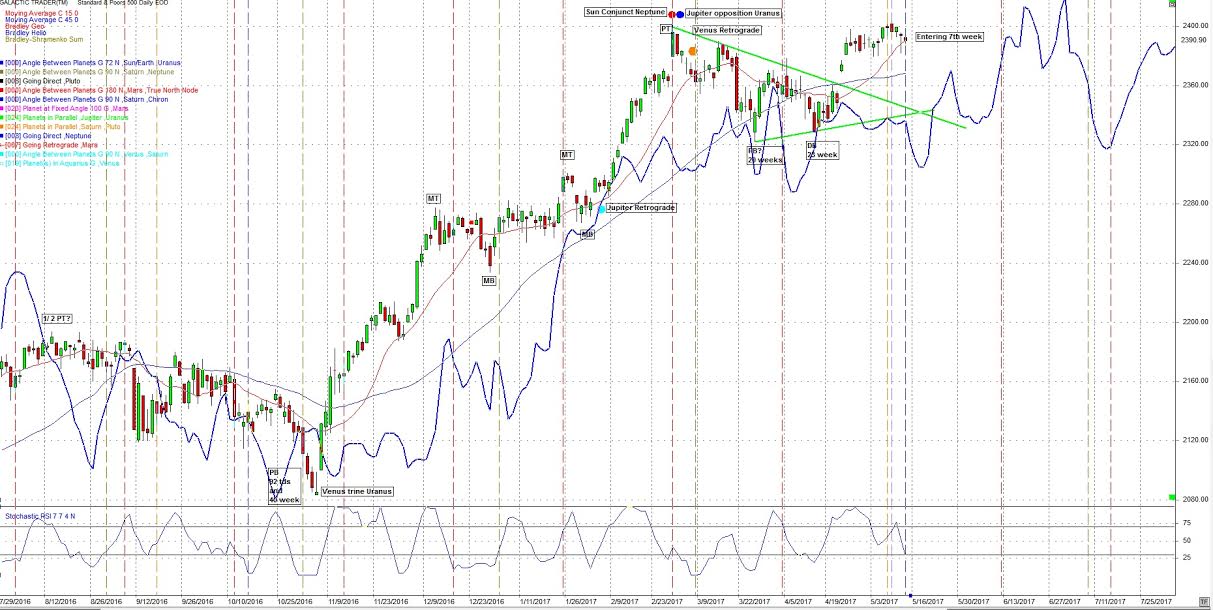
The following chart of the SP500 includes the heliocentric Bradley indicator (blue line). There are three possible change in trend dates, which maybe the 6 week lows on May 8th, May 12th and May 18th.
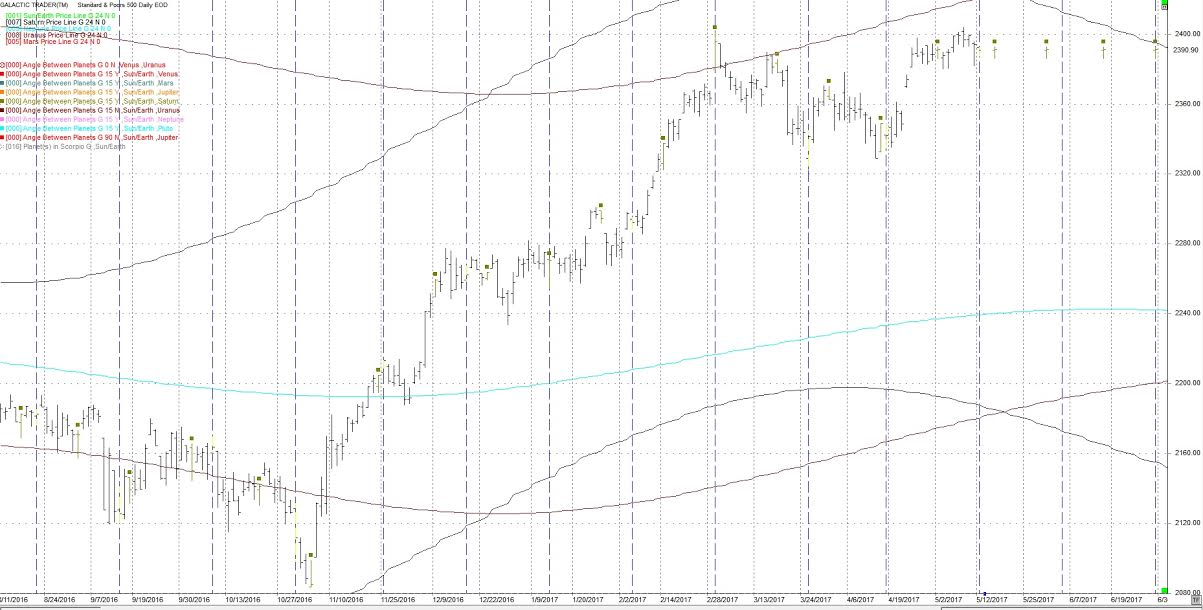
I continue to watch the 24th harmonic cycle (360 / 24) cycles for short term turns. The brown squares are Sun / Saturn 15 degrees on the following daily chart.
The last hit was on May 2nd.
The next hits are May 17 then May 31. Any could be the 6-week low.
I have added 3 price lines to this chart.
Saturn - black
Uranus - purple
Neptune - light blue
These price lines can act as support / resistance. Also on this chart are blue vertical line which is the 24 cd (calendar day) cycle. It has been at highs and lows.
The date of May 12 is the next 24 cd cycle.
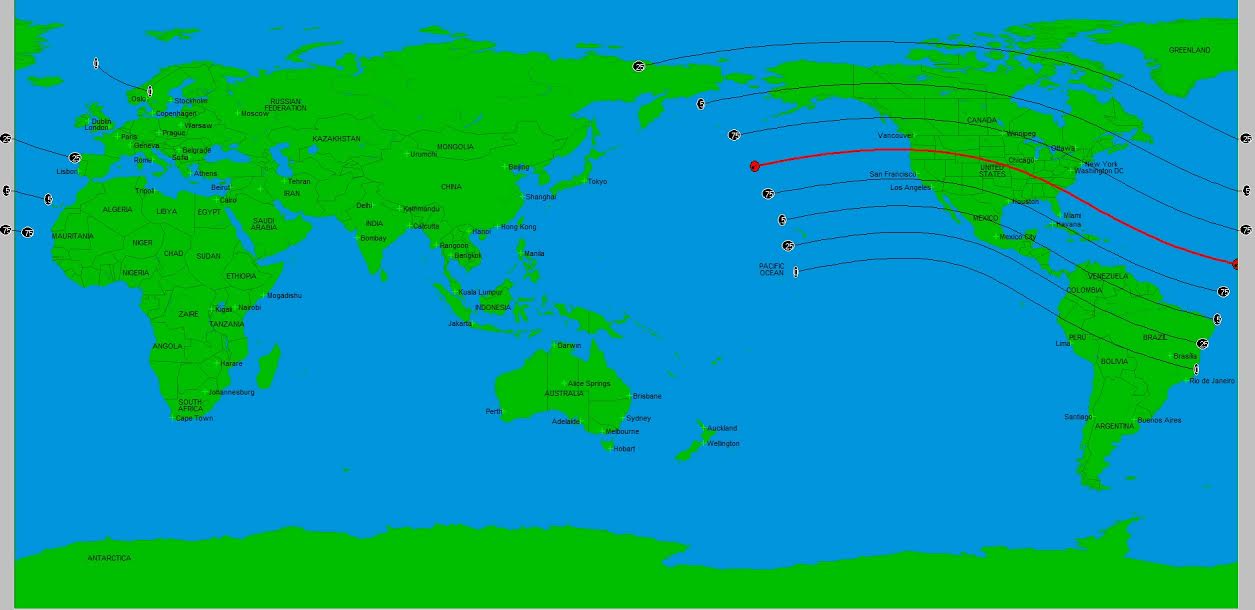
I brought up the August 21 Solar Eclipse in the May market letter. This should bring significant events in that time frame. In the mean time, I will monitor transits that may hit the location of the Solar Eclipse. An example in this blog is May 15th when the North Node transits over the point of the eclipse.
The path of this very important Eclipse is seen in the following:
Author

TradingDaze
Aisys Technologies Inc.
Gordon Lawson, aka TradingDaze, is a Canadian CPA, certified computer programmer and Astrologer. My traditional career spanned 25 years as a Financial Analyst at Suncor and Manager of Information Systems at BP Resources Canada. After this time Mr.


