SP500 Down into mid June

SP500
For the SP500, cycle-wise I’m looking at March 27th as the Primary cycle trough and April 13th as a double bottom.
This puts us entering the 9th week of a new Primary cycle. We got a 7 week pullback which should mark the first nominal 6 week cycle trough. The other possibility would be a ½ Primary cycle (9 week) which would be 1 to 2 weeks out.
We had a descending triangle (green) on the chart. As often happens price crashed through the upper line of the triangle, in effect gapping twice. Those gap areas may act as support. Note price moved down and bounced close to where the arms of the descending triangle met.
It should be noted Primary cycles (18 weeks) most often start with a nominal 6 week sub-cycle. The 2nd most common start is a 1/2 Primary or 9 week sub-cycles. The nominal range for the Primary cycle is 13 to 21 weeks. The recent highs were on March 1st closing at 2,396 in the SP500 then a high om May 25th at 2,418.71, a new All Time High.
I’m expecting volatility with both ups and downs but moving forward I’m looking for a low probably mid-June after reviewing the Astrological aspects.
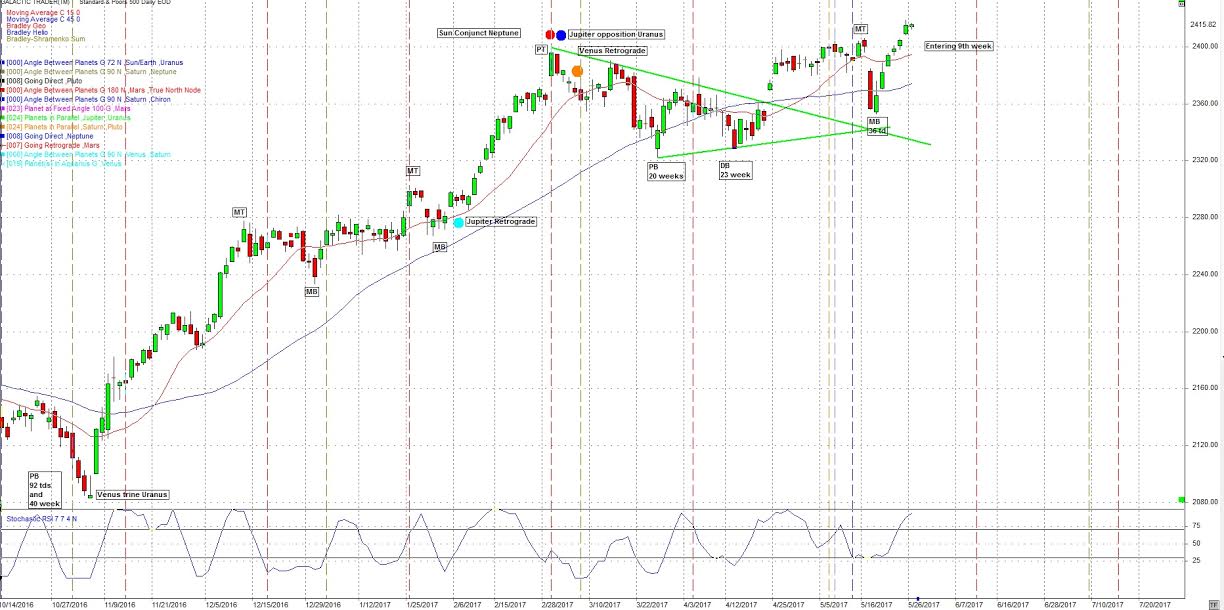
Recently we have had the 45 year aspect Saturn waning trine Uranus on May 19, the Venus opposition Jupiter on May 19 and Venus square Pluto on May 25th. The 45 year aspect requires a wide orb but the other two have a strong affiliation with cycle turns within 6-8 days. I’m expecting a high at any date and then a move down either next week or mid-June.
Note the 15 (red) sma and 45 day (blue) sma are both above price. Also note on May 25 and 26th price was stopped at the Saturn (black) price line.
Another cycle that has been at highs and lows is the 40 trading day cycle (td). Next due May 24th +- 3 tds.
Other Astros coming up this week are:
May 29 Mars opposition Saturn (US markets are closed).
Can effect a change in trend given a broad orb +- 11 td’s.
June 1 Venus trine Saturn
June 3 Venus conjunct Uranus
June 3 Venus trine North Node
Later this month we will have Jupiter turning direct and Neptune turning retrograde. These are within 5 td’s of each other and could be signaling a powerful change in trend. These are the two co-rulers of crude. We could see a change in trend in crude at the same time.
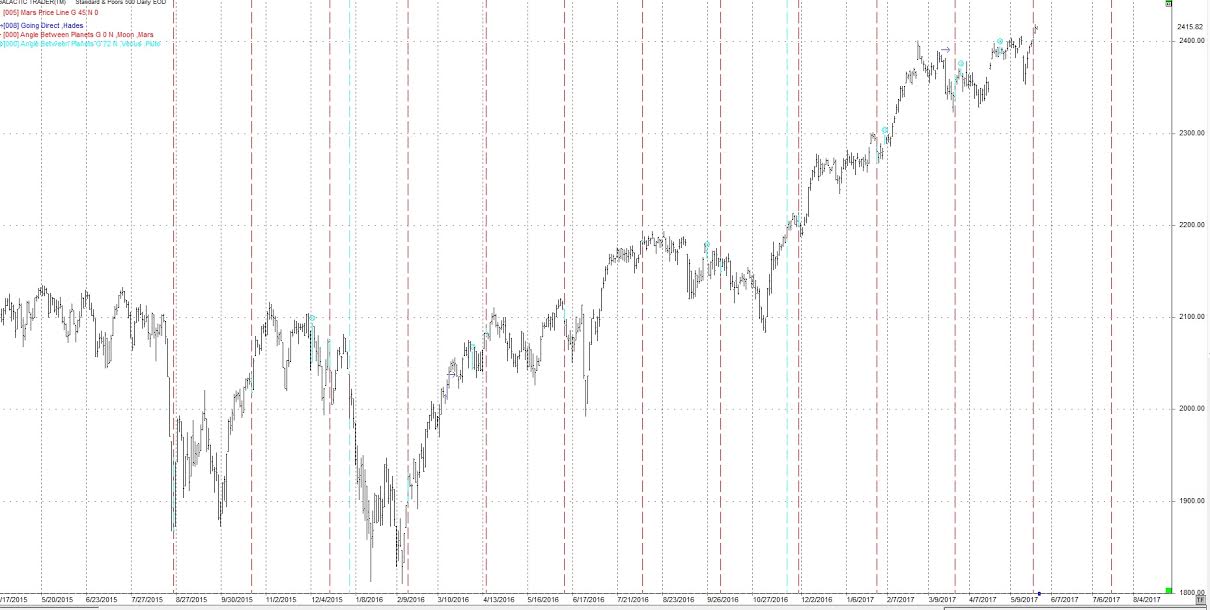
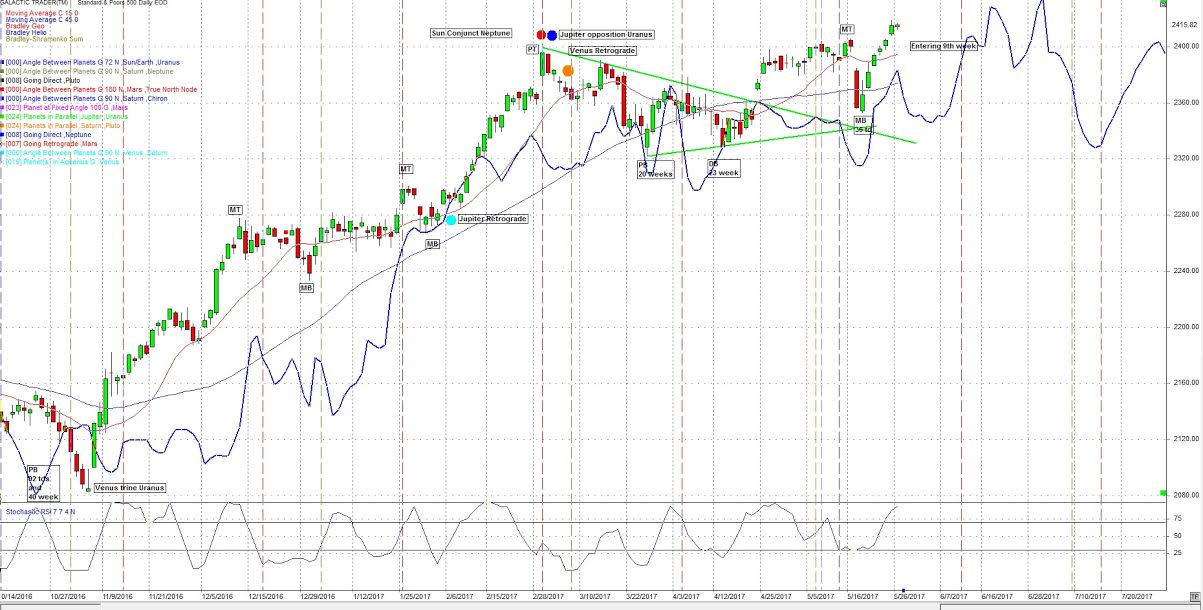
The following chart of the SP500 includes the heliocentric Bradley indicator (blue line). There were three possible change in trend dates, which may have been the 6 week lows. Coming up we have potential turn dates on
May 26th and late May, early June.
I continue to watch the 24th harmonic cycle (360 / 24) cycles for short term turns. The brown squares are Sun / Saturn 15 degrees on the following daily chart.
The last hit was on May 17th, the big move down.
The next hits are May 31 then. June 15th. Any could be the 6-week low.
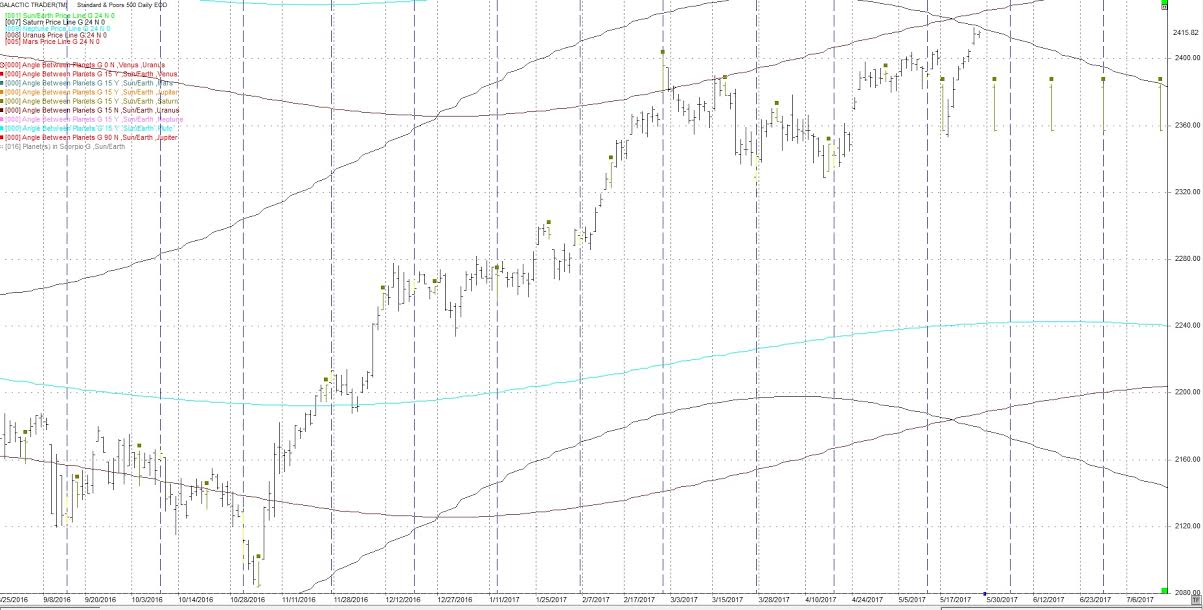
I have added 3 price lines to this chart.
Saturn - black
Uranus - purple
Neptune - light blue
These price lines can act as support/resistance. Also on this chart are blue vertical line which is the 24 cd (calendar day) cycle. It has been at highs and lows.
The date of June 5th is the next 24 cd cycle.
May 12 was the day the general population became aware of the Cyberwar that's been going on for some time. Note the references to May 12th above and the Mars waxing square to Neptune on May 11th.
I brought up the August 21 Solar Eclipse in the May market letter. This should bring significant events in that time frame. In the mean time, I will monitor transits that may hit the location of the Solar Eclipse. An example in this blog is May 15th when the North Node transits over the point of the eclipse.
The path of this very important Eclipse is seen in the following:
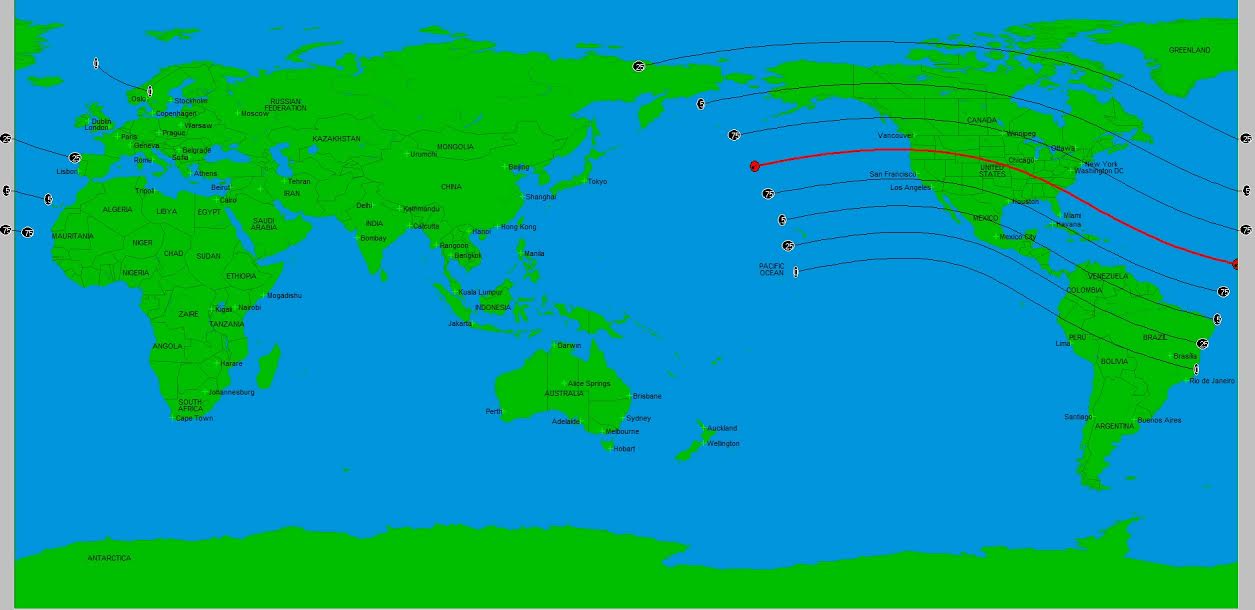
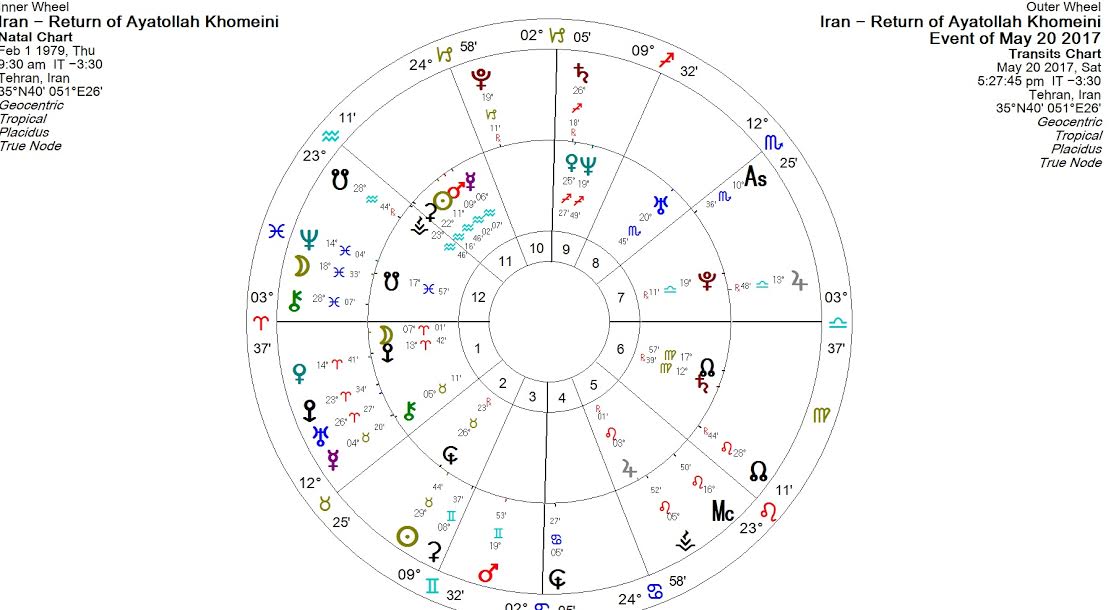
I added the chart of Iran to this post. The center circle is the Chart for Iran when the Ayatollah Khomeini returned to Iran. The outer circle is the planetary position for May 20, 2017.
Note the square between the natal Pluto and transiting Pluto. Also note transiting Mars is trine natal Pluto and transiting Mars is quintile transiting Pluto.
There is going to be trouble in Iran in the next few months. July / August may be it.
Author

TradingDaze
Aisys Technologies Inc.
Gordon Lawson, aka TradingDaze, is a Canadian CPA, certified computer programmer and Astrologer. My traditional career spanned 25 years as a Financial Analyst at Suncor and Manager of Information Systems at BP Resources Canada. After this time Mr.


