SP500 'Difficult Week Ahead'
The next 1/2 year Forecast Dates are available for purchase.
(January, 1 2017 - June 30, 2017).
Subscribers receive 6 months forecast no matter when they sign up.
SP500
For the SP500, cycle-wise November 4th was the Primary cycle trough. 1 which puts us entering the 22nd week of a nominal 18 week cycle. November 4th was the 40 week cycle trough as well.
It should be noted Primary cycles (18 weeks) most often start with a nominal 6 week sub-cycle. The 2nd most common start is a 1/2 Primary or 9 week sub-cycles. The nominal range for the Primary cycle is 13 to 21 weeks. Currently the high of this cycle was on March 1st closing at 2396 in the SP500. This high is very late in the cycle. It is very right translated which by itself would be bullish.
This cycle is so late I expect the cycle to expand, probably into the 22 – 23 week area.
We are do to have a Primary cycle trough.
With the upcoming Astrological activity, I expect the markets to be volatile over the next few weeks and moving down into that trough. The last 2 months have been unusual and very difficult to forecast.
To summarize, there was a tremendous move up from November 4, 2016. It went sideways starting in early December then up again near the Jupiter retrograde on February 6th. The US markets are very overvalued at this time.
From here the markets hit the Sun conjunct Neptune transit, the Jupiter opposition Uranus and Venus retrograde. These three, hitting aspects at least stopped the move up and the index has been trending down since the March 1st high. I have been expecting a sharper, deeper move down than we have seen so far.
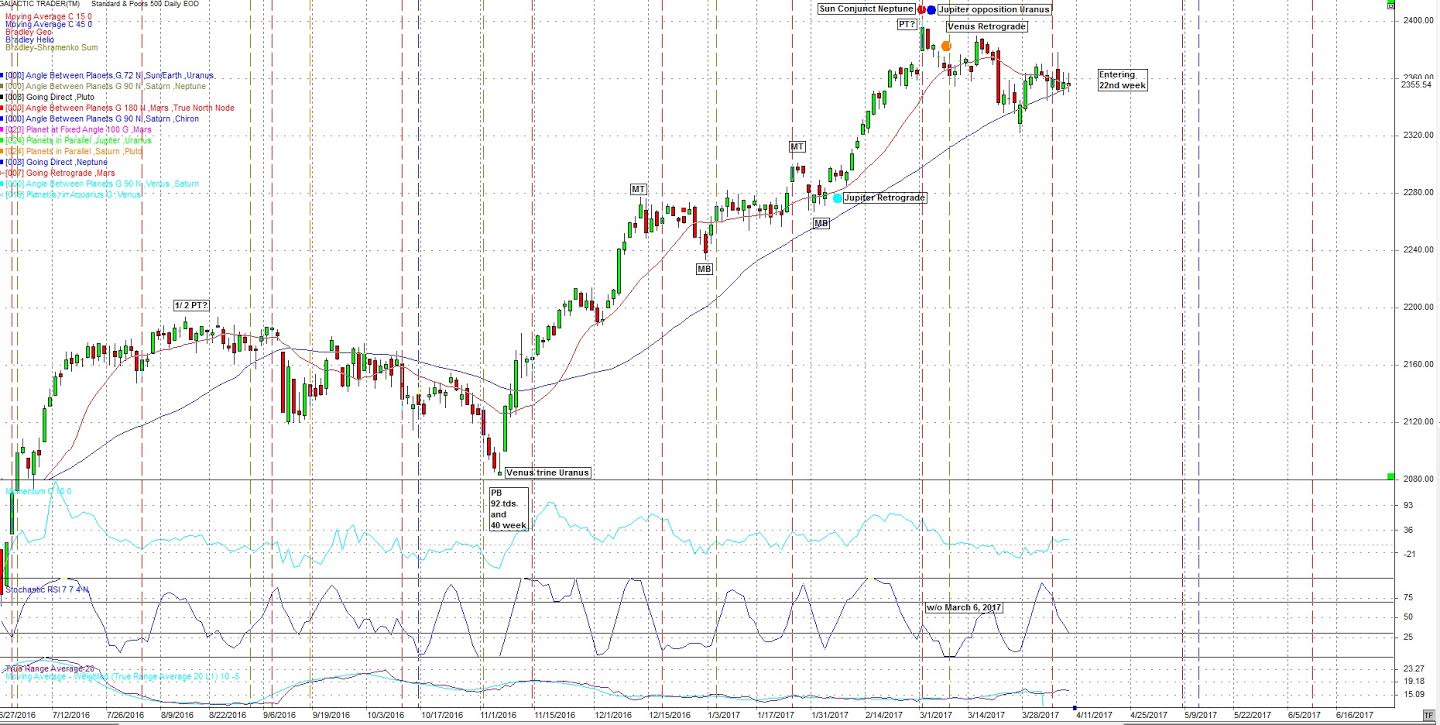
Note the 15 (red) and 45 day (blue) sma’s are touching. The look back for the 15 day sma is going to drop some higher values which by itself would mean the 15 day should move lower.
A look back of the 45 day sma gets us back to the early February area. Taking out the lower values out would mean, by itself, a move higher in the 45 day sma.
Having the 15 day lower than the 45 day is something we look for near a Primary cycle trough.
I’m expecting more price action to the down-side.
April is filled with powerful Astrological aspects and events. Don’t discount the aspects of the larger planets. They can cover longer periods of time. For example, last week we had Saturn going retrograde. This can last for a number of weeks and is a period of review, taking stock, restriction, fear and correct recent mistakes.
This is a month of retrogrades. The following planets turn retrograde or direct this month; Saturn retrograde, Mercury retrograde, Venus direct and Pluto retrograde.
Next week, starting on Saturday:
April 8 Venus waxing square Saturn.
Saturn is retrograde and Venus is slowing, preparing for it’s move to direct motion. Saturn retrograde is review, correct mistakes, fear and depressing news. This has a history of occurring close to Primary cycles. Due to the current position of the SP500 I would say it should be near a Primary cycle trough. Venus square Saturn could stand for restriction of money or restriction on something? Deflation?
This aspect is emphasized as it appears twice due to retrograde motion. Once on April 8 then later in the month.
April 9 Mercury Retrograde
Mercury rules buying, selling, communications, short trips and trading. All these areas can get confusing during the retrograde period. This may be close to a Primary cycle move. If possible don’t sign agreements or make long term decisions during the Mercury retrograde period. “The Trickster”
April 11 Pluto square the Full Moon (Moon in Libra, Sun in Aries.
Pluto is control and tearing down to build anew. It is also debt and we should watch issues around debt during this period. This may also be a short period of fear or the start of a more prolonged period. Pluto is also threats to security attacks or planning for attacks.
April 14 Sun conjunct Uranus
The Sun and Uranus are volatile. This could be a signature for sudden reversals in the trend of the markets. Last week we covered sidereal Uranus and it’s 42 year cycle. The Sun will conjunct Uranus very close to that position in the sidereal Zodiac. For those with interest I used the Lahiri zodiac.
April 15 Venus direct.
This signature is often found at market truns. Again, Venus is money among other things.
There are others later in the month but that’s the coming week.
Venus
The following chart shows Venus retrograde, the Inferior conjunctions of Venus and the Sun and Venus going direct coming up on April 15th. Read the last couple of blog post for more info on Venus retrograde.
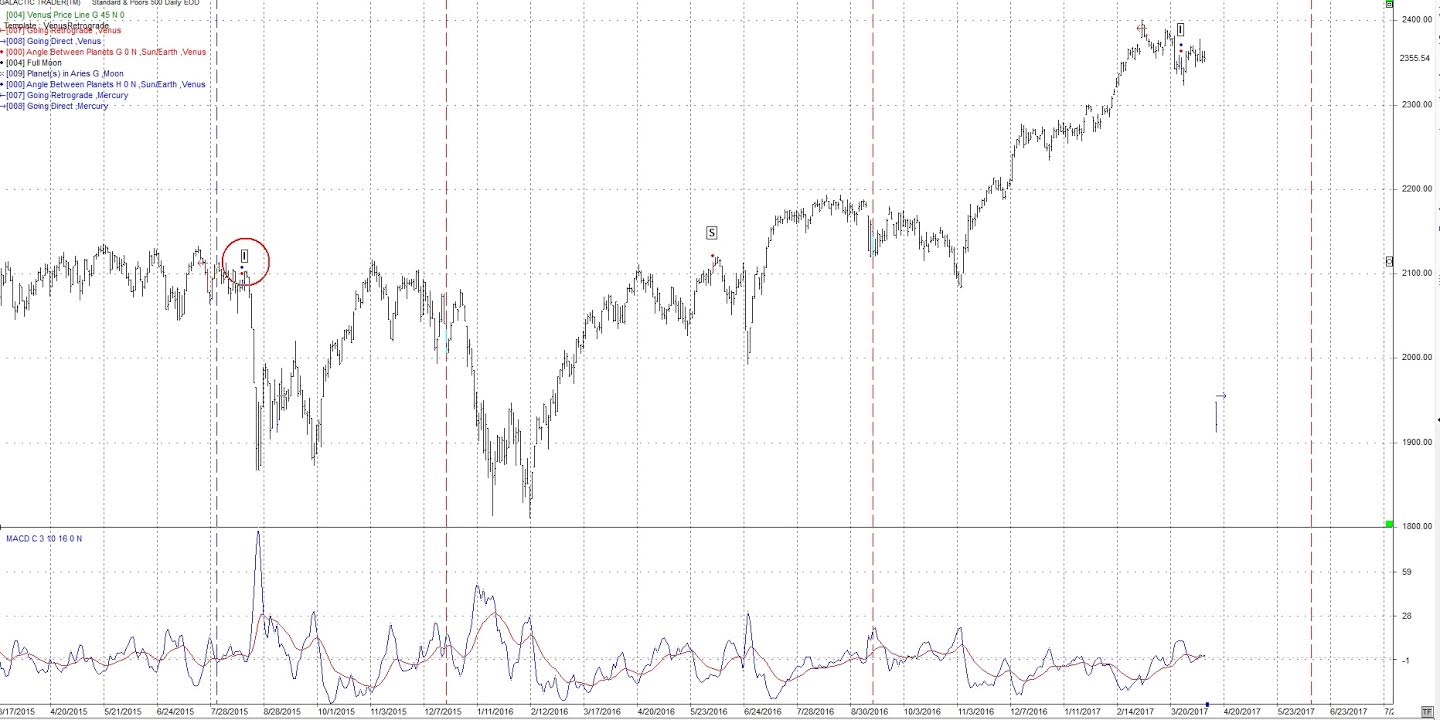
The Venus Direct signature often occurs at a move in the SP500 both up and down. I’ll be looking for a move down. It is the blue arrow on the chart.
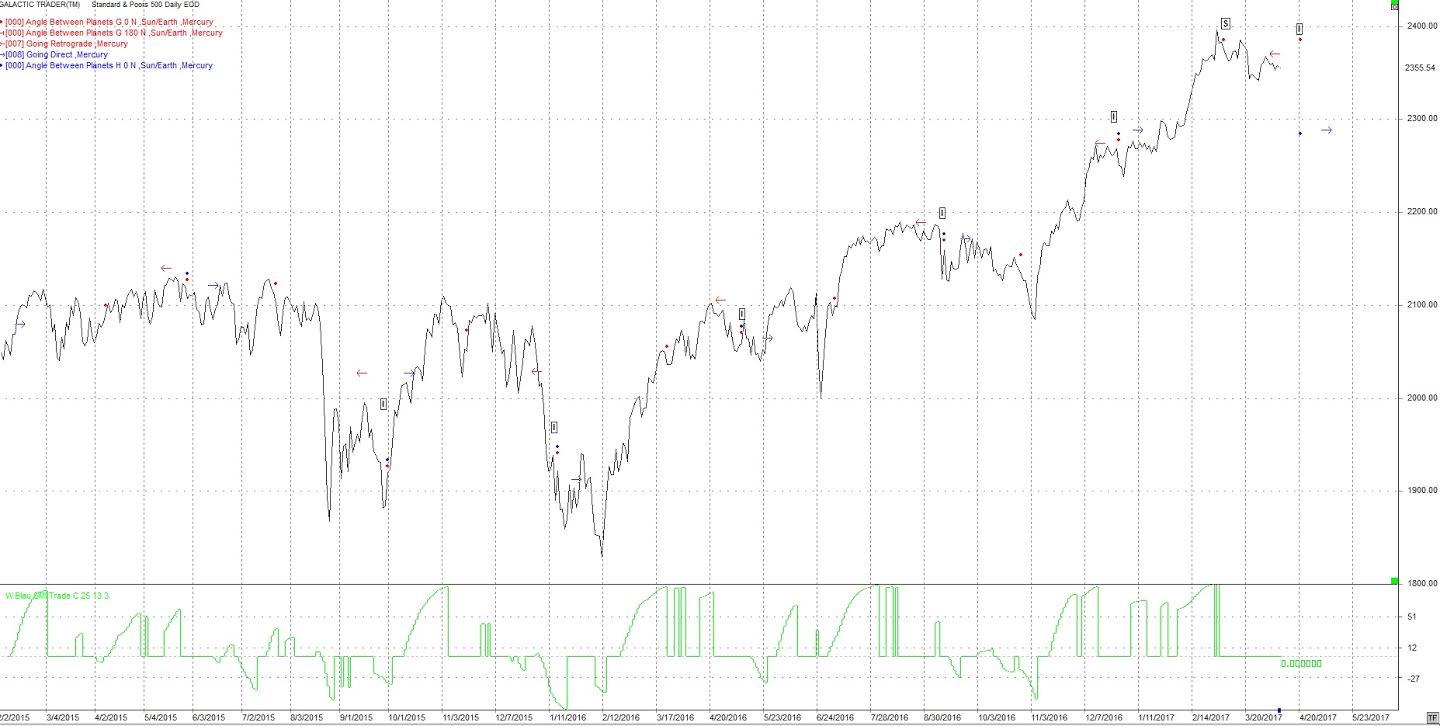
Mercury
The other planet inside the Earth’s orbit is Mercury. It too has inferior and superior conjunctions. On the chart the red arrow is Mercury turning retrograde, then the Inferior conjunction of the Sun and Mercury and then the blue arrow which means returning to direct motion. Mercury can be a very confusing time.
From last week.
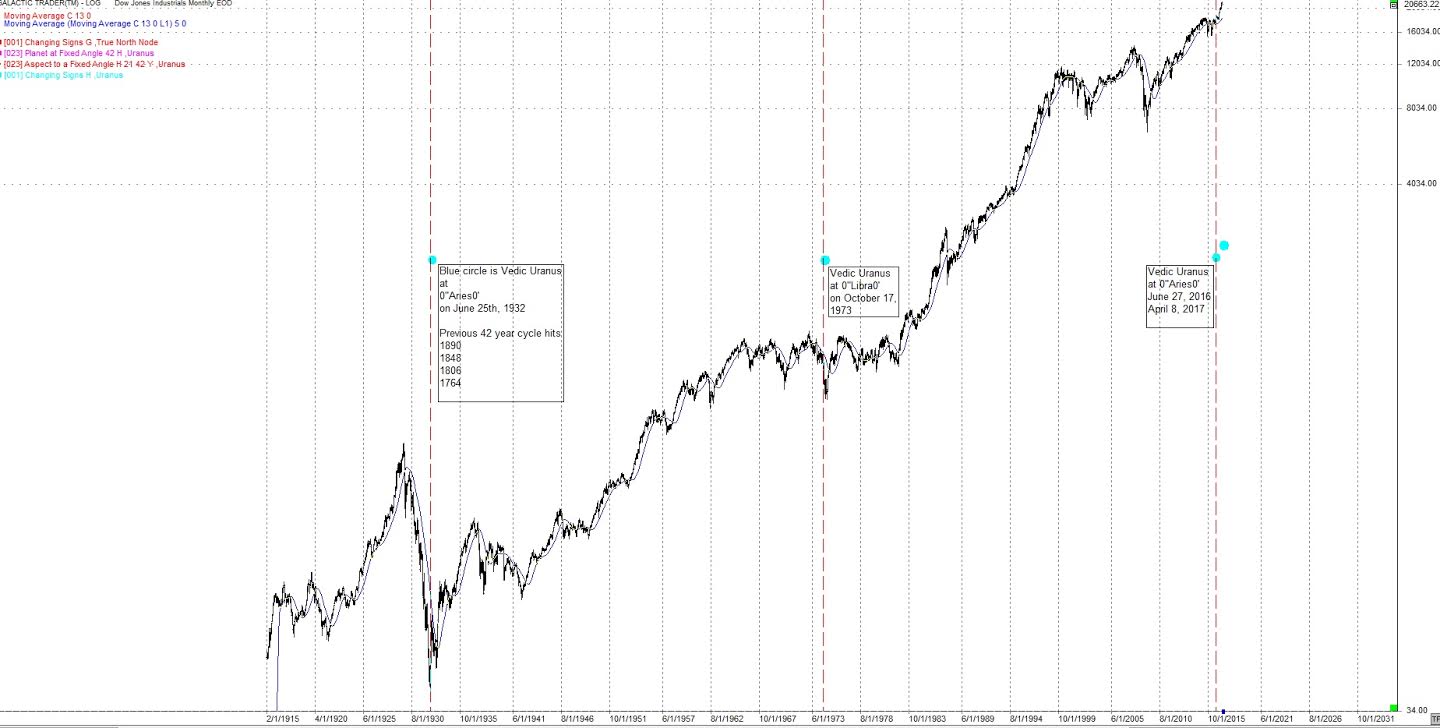
Sidereal Uranus.
Of possible importance, there is also a Vedic (Indian Astrology) aspect which is sidereal Uranus crossing into Aries. This could be powerful. The following is a monthly chart. Uranus takes approx.. 84 years for one trip around the Sun. The following chart shows the last 2 times Uranus passed over a cardinal point. We are looking at the last light blue dot. Give this +- 3 weeks.
All the longer term Astrological aspects and events still apply. See previous blog posts.
Watch for potential geophysical events, violent weather or increased conflict. Mars is the planet of war, conflict and aggression. We had noted this last week and we got the USA bombing Syria on April 6th the same day Mars trined Pluto. A war aspect. From other sources, there may be an event or issue with water in the USA. This summer may see increased geophysical activity, particularly around the Solar eclipse.
As mentioned in previous weeks both Israel and Egypt (mid-East) may come to the fore this year as regards to conflict and aggression. Iran and Turkey may be included as well. This may be seen before the end of April. This is connected to the on-going Saturn/Uranus trine, a 45 year aspect which is exact again on May 19th.
Mars is active and can result in war or conflict. The US should stay out of any conflicts as they should concentrate on growing health and legal problems at home. If the US does get involved it could result in many casualties. At this point watch Syria.
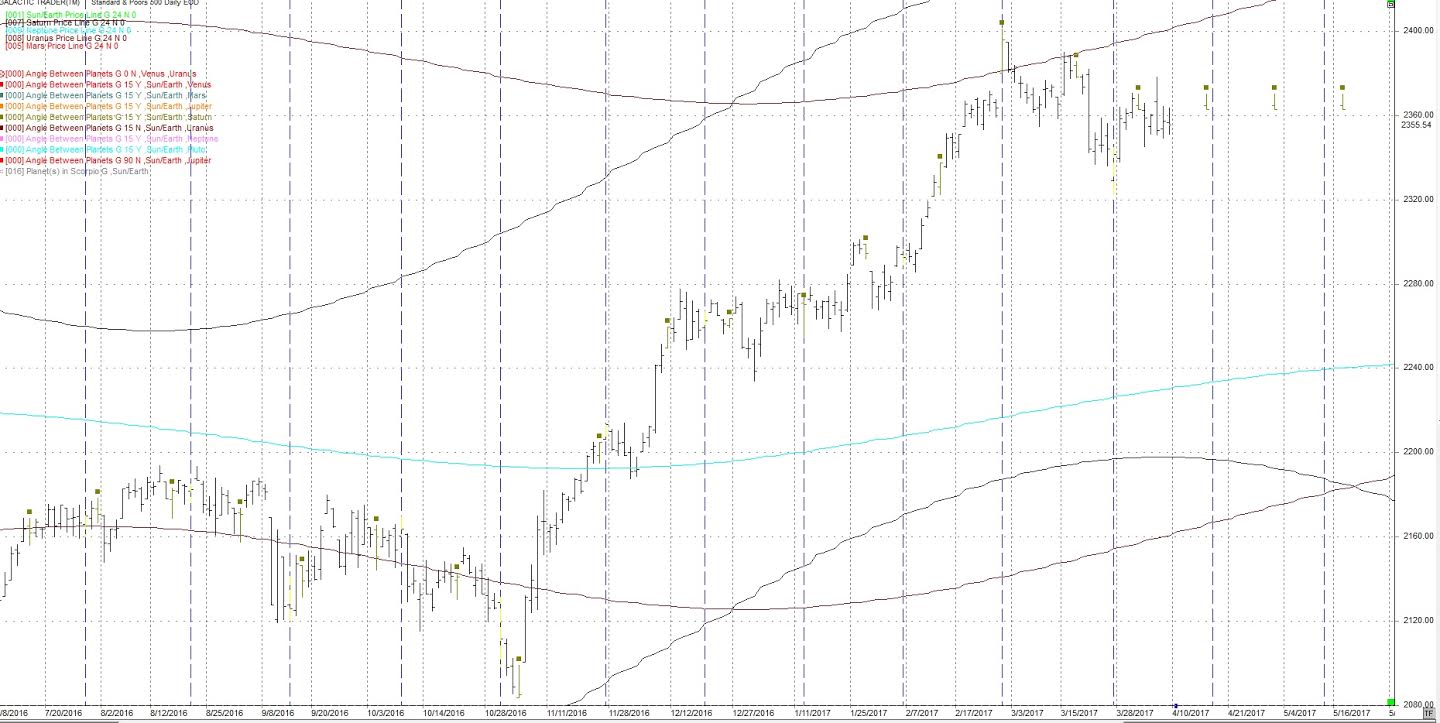
I continue to watch the 24th harmonic cycle (360/24) cycles. The brown squares are Sun/Saturn 15 degrees on the following daily chart.
The last hit was on March 31
The next hits are April 17th then May 2nd.
I have added 3 price lines to this chart.
Saturn - black
Uranus - purple
Neptune - light blue
These price lines can act as support/resistance. Also on this chart are blue vertical line which is the 24 cd (calendar day) cycle. It has been at highs and lows.
The date of March 1st is the same date as the 24 Harmonic. We went down.
Looking forward I'm expecting difficult markets April timeframe.
Author

TradingDaze
Aisys Technologies Inc.
Gordon Lawson, aka TradingDaze, is a Canadian CPA, certified computer programmer and Astrologer. My traditional career spanned 25 years as a Financial Analyst at Suncor and Manager of Information Systems at BP Resources Canada. After this time Mr.


