SP500 Closer to a Pullback

SP500
For the SP500, cycle-wise November 4th was the Primary cycle trough. 1 which puts us entering the 19th week of a nominal 18 week cycle. November 4th was the 40 week cycle trough as well.
I have a family situation so this post will be short.
The 1st Half 2017 Forecast dates, given to subscribers, are estimated from Astrological events only. As time unfolds we have the benefit of market cycles and possibly additional Astrological events. Nevertheless the original dates have fared very well. See the blog post of December 11, 2016, showing the original forecast dates for the SP500. These are the original 6 month dates with no adjustments for the last 3, 6 month periods.
It should be noted Primary cycles (18 weeks) most often start with a nominal 6 week sub-cycle. The 2nd most common start is a 1/2 Primary or 9 week sub-cycles. The nominal range for the Primary cycle is 13 to 21 weeks.
I'm looking for closes below 20,780 for the DJIA and lower than 2357 for the SP500. If we can get below those levels then this will identify the last few weeks as the end of a topping process.
We are in the difficult period of time mentioned for some time. The exact date for a number of the heavy transits have either passed or they are in front of us. Note there are a number of longer term transits in effect which are reserved for subscribers.
To summarize, there was a tremendous move up from November 4, 2016. It went sideways starting in early December then up again near the Jupiter retrograde on February 6th. From here the markets hit the Sun conjunct Neptune transit, the Jupiter opposition Uranus and Venus retrograde. These three hitting so close together should have given us a larger move down, change in trend. We went up today, March 10, after the employment report, but expect the market to move lower as the 18 week trough should be in front of us.
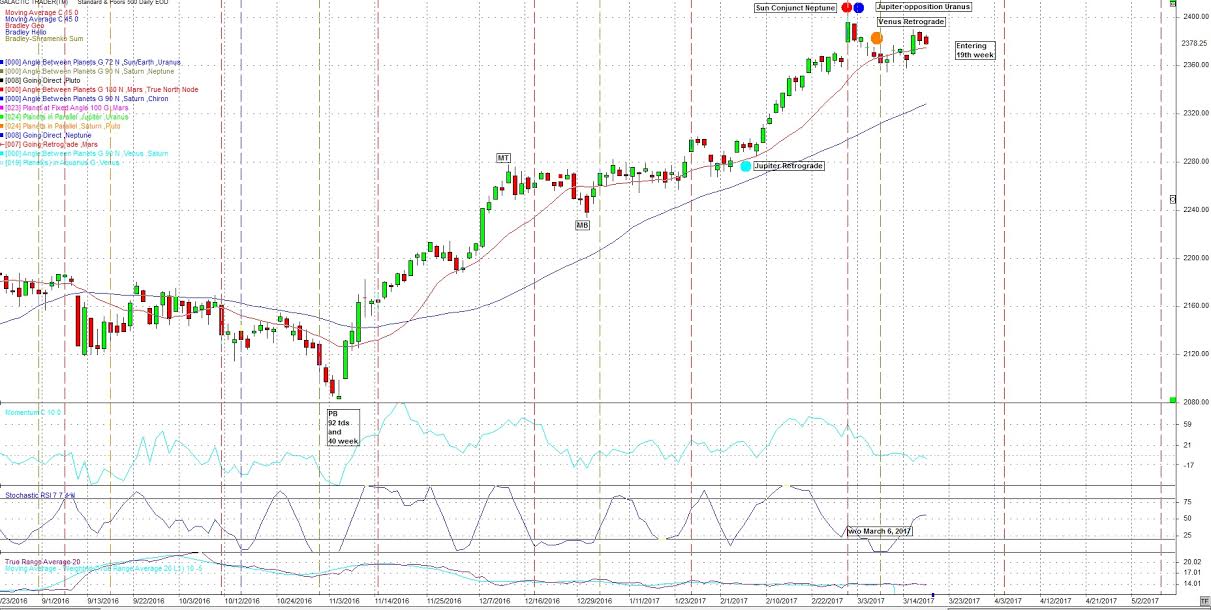
I had mentioned the middle two weeks of March 2017 have less powerful transits. There is a Sun squared Saturn on March 17th and on March 25 the Venus inferior conjunction with the Sun. The inferior conjunction of the Sun and Venus is in the middle of the Venus retrograde period and can be just as strong as the Venus retrograde and Direct dates.

Next week has a couple of more potent days.
March 20th is the Spring Equinox, the day the Sun moves into Aries, a cardinal point. This is Western or Hermetic Astrology as opposed to Vedic or Indian Astrology. Although we call it Western Astrology it came from the area now known as Iraq. From here it went to Egypt then Greece then Europe and on to North America, The first vestiges of Astrology came from both India and the Iraq area.
While the Sun enters Aries there will be a Moon / Saturn conjunction near the Mid-Heaven. The Moon represents the people and matters of a common or public nature. Saturn stands for mature populations (Japan?) , epidemics, farms, mines, coal, minerals. Saturn can also stand for State funerals, public sorrow and disappointment.
Neptune is close to the ascendant on the Spring Equinox, Neptune stands for left wing politics, it is linked to mobs and secret plots, sedation, fraud, loss, vice and liquidation. Illusion and delusion are also present. Neptune could affect crude, up or down. Watch closely next week. Neptune is strong. It is in Pisces the sign that it rules. I've mentioned a number of times of a water event in the US. Pisces is a water sign.
I'm looking at this as a pull back next week and bought a starter position in a bear ETF on the SP500, based on recent history.
The Spring Equinox chart can be used as an Astrological chart for the whole year.
This is the beginning of the Astrological New Year. This chart is a representation of what to expect in the coming year. You can create this chart for the countries capitol or in my example for New York , the financial centre of the USA and the world, for now.

To no one's surprise the FED raised rates. Secondly the Debt Ceiling Holiday created by Obama and Boehner is over. I believe the end date is June 1st. Watch this in the news. It could become very important.
Watch for potential geophysical events, violent weather or increased conflict. Mars is the planet of war, conflict and aggression. From other sources there may be an event or issue with water in the USA.
Looking to the next Presidential election, 2020 Jupiter and Saturn will be conjunct near the cusp of Aquarius an Air sign. More on this and the Mutation conjunction of Jupiter and Saturn in the March subscribers report. The Jupiter / Saturn conjunction is a 20 year aspect and changes element approx. every 180 years.
At this point March 1st could have been the crest of the current Primary cycle and
March 19, 2017 +- 3 weeks, the Primary cycle trough. Early April is another possibility with 4 strong Astros which have a history of a change in trend.
The March 6, 2017 forecast was first mentioned in our blog post of November 14, 2016.
On March 7th +- 3 weeks, Saturn conjuncts the Galactic Center. This multi week period could define a move down. This may be very important. Bear in mind we are in an 8 year bull market. A move down could start at any time, the above are the most probable from an Astrological perspective.
As mentioned in previous weeks both Israel and Egypt (mid-East) may come to the fore this year as regards to conflict and aggression. Iran and Turkey may be included as well. This may be seen before the end of April. This is connected to the on-going Saturn / Uranus trine, a 45 year aspect which is exact again on May 19th.
Mars is active and can result in war or conflict. The US should stay out of any conflicts as they should concentrate on growing health and legal problems at home. If the US does get involved it could result in many casualties.
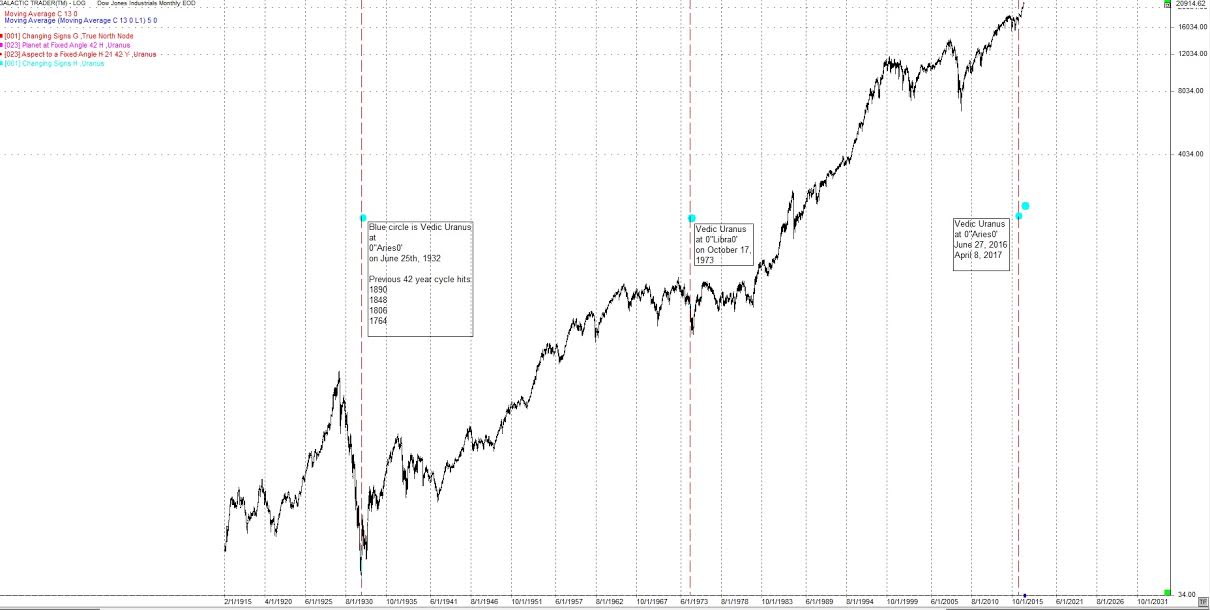
Coming up before month end we have the Jupiter square Pluto aspect. This aspect is exact within 1 day for the geocentric and heliocentric aspects. This aspect has a history of international terrorism and can effect economic cycles. The last week of March and most of April should be dramatic. In particular the period around April 8th where we have Uranus entering sidereal Aries. Watch this period closely. The following monthly chart of the DJIA shows some history of Uranus passing over sidereal Aries. Bear in mind this is a monthly chart and Uranus moves quite slowly.
Harmonics
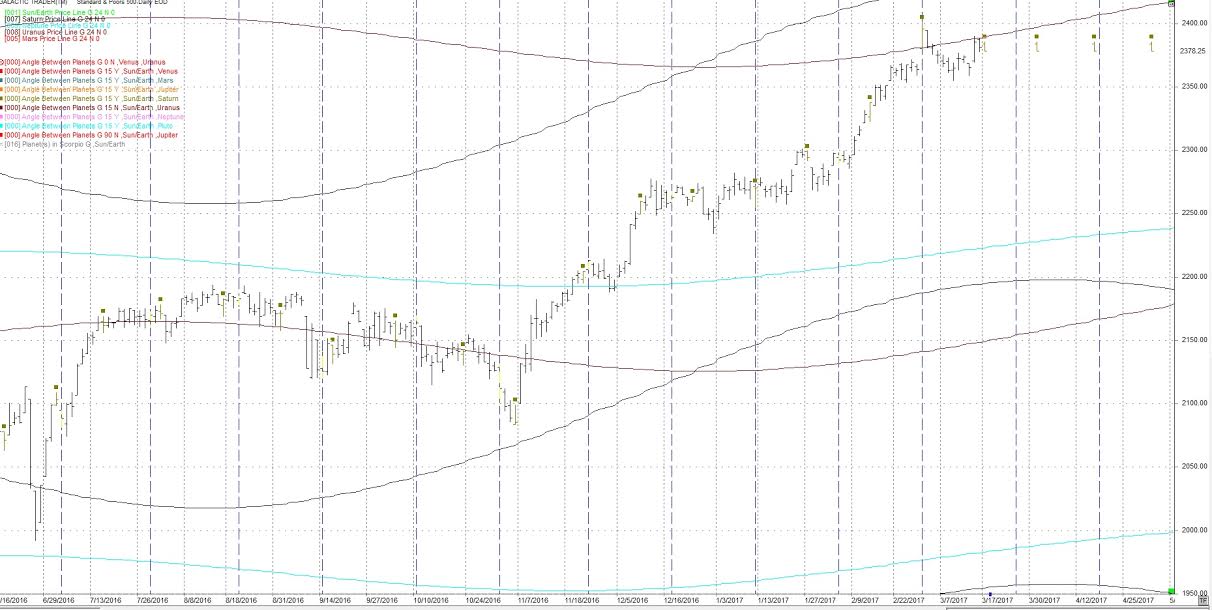
I continue to watch the 24th harmonic cycle (360 / 24) cycles. The brown squares are Sun / Saturn 15 degrees on the following daily chart.
The last hit was on March 17th.
The next hits are March 31, 2017 then April 17th.
I have added 3 price lines to this chart.
Saturn - black
Uranus - purple
Neptune - light blue
These price lines can act as support / resistance. Also on this chart are blue vertical line which is the 24 cd (calendar day) cycle. It has been at highs and lows.
The date of March 1st is the same date as the 24 Harmonic. We went down.
Looking forward I'm expecting difficult markets in the late March through April timeframe.
There have been a number of earthquakes over the last couple of weeks. I'm expecting more particularly August. I look for earthquakes 6.5 and over.
Author

TradingDaze
Aisys Technologies Inc.
Gordon Lawson, aka TradingDaze, is a Canadian CPA, certified computer programmer and Astrologer. My traditional career spanned 25 years as a Financial Analyst at Suncor and Manager of Information Systems at BP Resources Canada. After this time Mr.


