SP500 climbing the wall of worry?

Stocks appeared to be making a decisive move higher yesterday, and then a sharp move lower struck. Did it have a catalyst, and if so, what can we make out of today’s premarket upswing? How does it reflect on the technical outlook for stocks?
Let’s start with the S&P 500 daily chart.
SP500 in the Short-Run
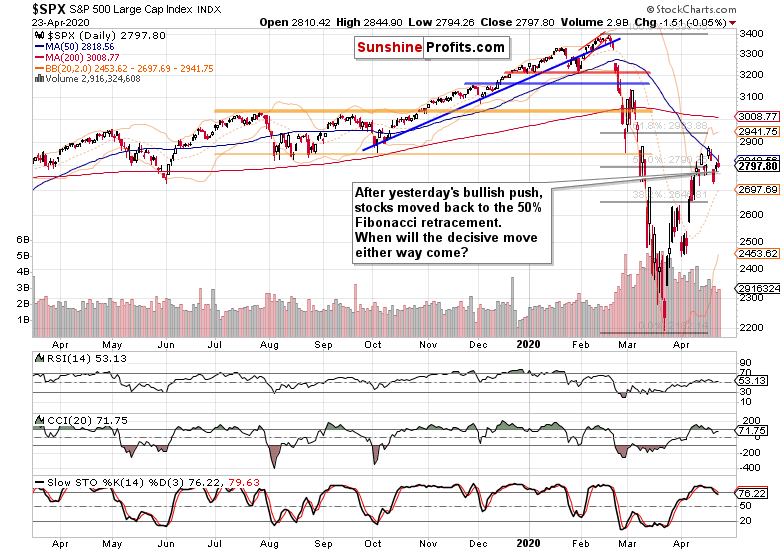
Negating Wednesday’s selling just before the close, S&P 500 opened higher yesterday. The buyers kept adding to their gains, and then prices just rolled over. In the fundamental part of today’s Alert, we’ll discuss the catalyst. The selling pressure shows as the upper knot with a close at the daily lows in yesterday’s candle.
To count as a meaningful reversal though, the volume could have been bigger to make it credible. This way, it can just as easily be a news-driven daily selloff that extends the consolidation before stocks take on the nearest set of resistances again.
Yes, S&P 500 is struggling around the 50% Fibonacci retracement at the moment. But has it rolled over and kept moving down when faced with grim incoming economic and coronavirus news? No, it rather appears to be shaking them off. Stocks are actually quite resilient, just as they were in early April with all the 12-month plus lockdown speculations making the round and no economy reopening hopes in sight.
Perhaps this means that the market now actually wants to go higher. Does that mean we have a bull market? While it’s encouraging that the market doesn’t really sell off on bad news, the present upswing (stabilization at higher levels) may still turn out to be a bullish leg up within a trading range that spans over weeks and potentially months. Therefore, we’re not calling it a bull market.
Remember, stocks aren’t yet trading back above the 50% Fibonacci retracement on a closing basis. Once they do, and also take out both the 61.8% Fibonacci retracement and the early March bearish gap with ease, that would be what we’re looking for. Combine that with the stocks to Treasuries ratio going higher, these would be the essential preconditions. For good measure, let’s have it supported by favorable sectoral internals of the advance too.
Such was the snapshot of stock market health in the unfolding upswing that we’ve shared within our yesterday’s intraday Stock Trading Alert. It justified doing away with the hedge and keeping only the long part of the trade intact:
(…) While the S&P 500 upswing might seem not to be overly dramatic so far, it’s the internal health of it and the accompanying credit market performance that is catching our eye.
Let’s start with the S&P 500 sectors - technology (XLK ETF) is holding much of today’s gained ground, healthcare (XLV ETF) is doing even better and the financials (XLF ETF) appear to be forming a base. Even hard-hit energy (XLE ETF) is going higher while materials (XLB ETF) appear ready to move up some more. This would be confirmed by the consumer discretionaries to staples ratio’s peek higher as it’s also utilities (XLU ETF) that are struggling at the moment. These are favorable conditions for the financials to utilities ratio to move up down the road as well.
In conclusion, the above factors would point to a budding transition to the risk-on sectors in the S&P 500 rally.
As for credit markets, high yield corporate bonds (HYG ETF) appear to be readying for an upside move while municipals (HYD ETF) are stalling and investment grade corporate bonds (LQD ETF) are moving gently higher. In contrast, longer-dated Treasuries (IEI ETF) are struggling to recover ground lost yesterday as short-term Treasuries (SHY ETF) are looking to extend their decline.
In conclusion, these point to improving financial conditions and supports increased risk appetite – all in the absence of additional Fed support, which has been actually gradually tapered over the preceding weeks. To see the markets move higher in such circumstances, is encouraging, especially since there’s no stock selloff as the almost $500bn aid package has become a virtual certainty.
That’s a bullish constellation at least for the short-term.
Let’s dig into the key details now that we are armed with yesterday’s closing prices.
The Credit Markets’ Point of View
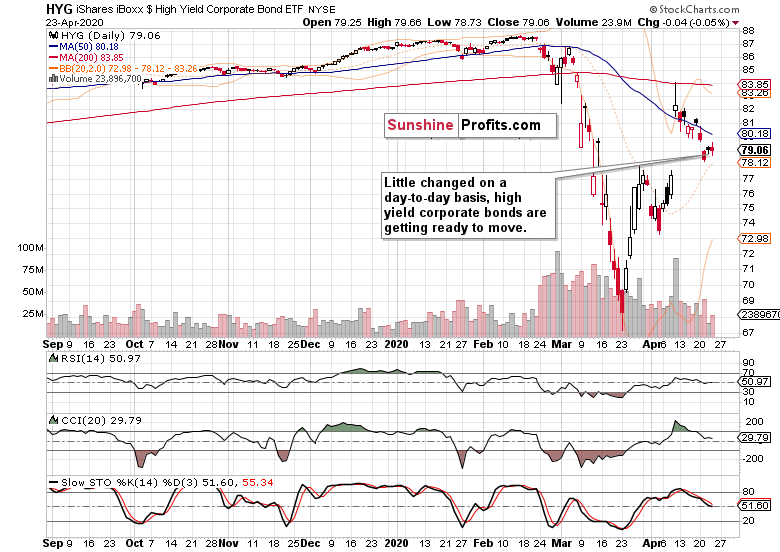
High yield corporate bonds (HYG ETF) didn’t break down yesterday. Neither did their ratio to short-term Treasuries (SHY ETF). As they’ve been consolidating over recent sessions, a bigger move appears to be at hand. Arguably, the more time it takes without HYG declining, the better the chance for their rebound higher.
Would an examination of the stock market itself to Treasuries help?
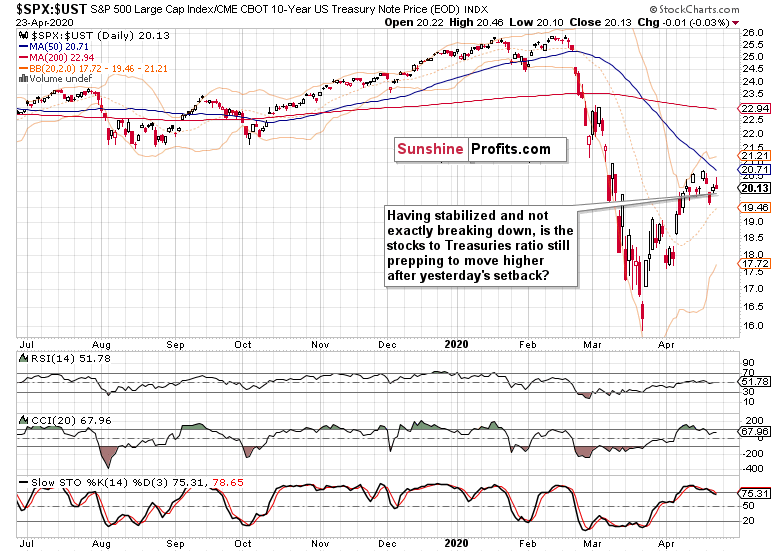
This metric shows the rejection of yesterday’s S&P 500 upswing more clearly. Still though, we haven’t seen any breakout. It’s just a congestion out of which one might very well develop as the pressure to go higher appears to be building up.
Can the S&P 500 sector ratios sharpen the picture that the credit markets are leaving relatively blurry?
Key SP500 Sector Ratios in Focus
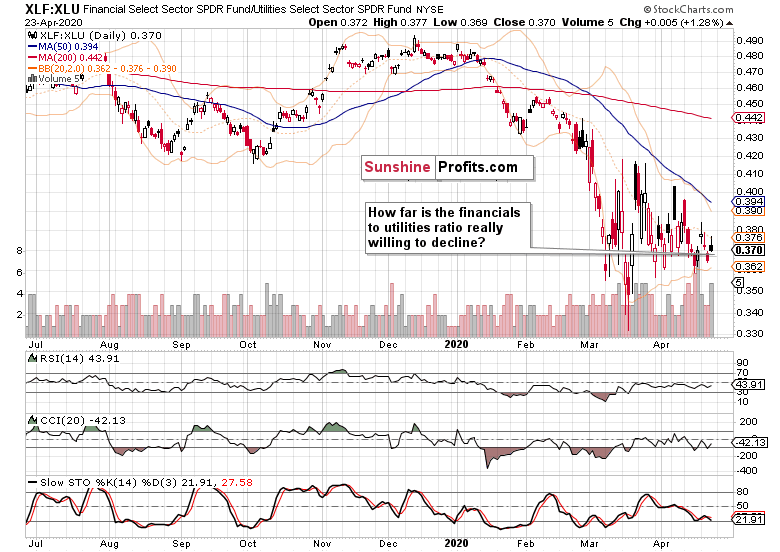
Despite yesterday’s S&P 500 decline, financials (XLF ETF) outperformed utilities (XLU ETF). This sends a subtly bullish message as it appears that the ratio isn’t really ready to move much lower. Should we see it breaking above the declining resistance line formed by the March and April highs, that would result in an entirely different takeaway – a bullish one.
As we’re not quite there yet and therefore can’t really act on such a possibility, what about the consumer discretionaries to consumer staples ratio?
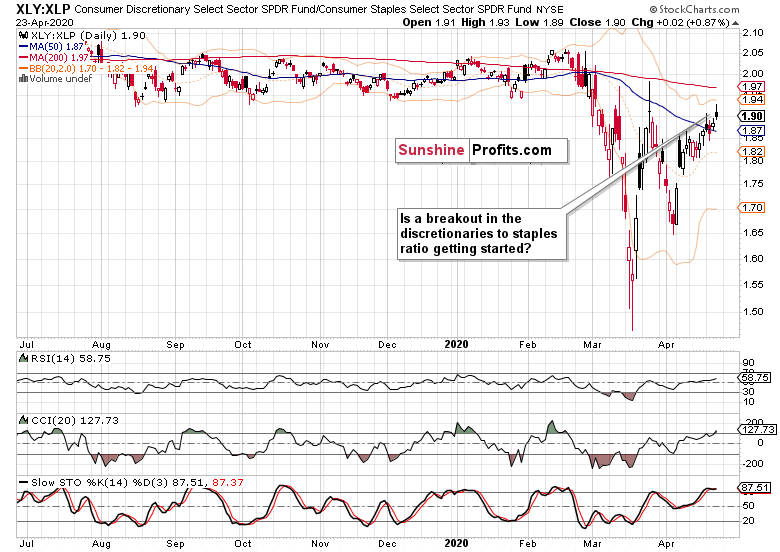
This one has already moved out of its congestion. As it was to the upside, that’s a bullish sign. It’s almost at the very early March highs, and definitely higher than was the case later throughout both March and April. It points to the bulls not having given up.
The Fundamental SP500 Outlook
It’s high time to discuss yesterday’s breaking news that helped to move S&P 500 down. It was the Chinese report on the first randomized clinical trial of Gilead’s Remdesivir, the supposed silver bullet. As it flopped, hopes were dashed – though Gilead objected to the study’s early termination, calling it inconclusive. In light of such news, it’s truly encouraging that the S&P 500 futures are now (well before 7 am Eastern Time) attacking the 2800 handle again.
In other news, it’s promising to see NYC residents’ immune systems at work, as full 14% may already have coronavirus antibodies. As this Swedish study shows, this may be the case for up to a third of Stockholmers too. This builds on our yesterday’s points regarding the relaxed approach that Belarus also takes.
Keeping an eye on such developments will help us assess the prospects of US economy reopening, and the degree thereof. These are vital clues for the stock market, and naturally, we expect the rural parts to be the first to open up. Just when will the key cities join, and what kind of shape will the consumer be by then, is the $64,000 question.
Summing up, while the S&P 500 suffered a setback yesterday, the bullish case is far from lost. Overnight, prices returned to trading back above the 50% Fibonacci retracement. The key sectoral ratios (financials to utilities, and especially discretionaries to staples) favor the upswing attempt to continue. Credit markets aren’t sending a warning sign on a day-to-day basis. The ease with which bad news (economic or corona-related) are ignored, gives the bulls the benefit of (perhaps even more than) a short-term doubt. Stocks appear to be ready to move higher and our long position remains justified.
Want free follow-ups to the above article and details not available to 99%+ investors? Sign up to our free newsletter today!
Want free follow-ups to the above article and details not available to 99%+ investors? Sign up to our free newsletter today!
Author

Monica Kingsley
Monicakingsley
Monica Kingsley is a trader and financial analyst serving countless investors and traders since Feb 2020.
















