SP500 "Change In Trend"

SP500
The last Primary cycle low was August 21st, the day of the Total Solar Eclipse. The standard for the Primary cycle is 18 weeks. We are now starting the 19th week of the SP500 Primary cycle which has a range from 15 to 23 weeks. This has been an unusual time with the general market indices seemingly unstoppable.
Some of the cycles that are coming due are:
- The Primary Cycle (nominal 18 week)
- 9 / 18 month cycle
- 5 / 10 week.
These are all coming due. See the charts below
The Primary Cycles
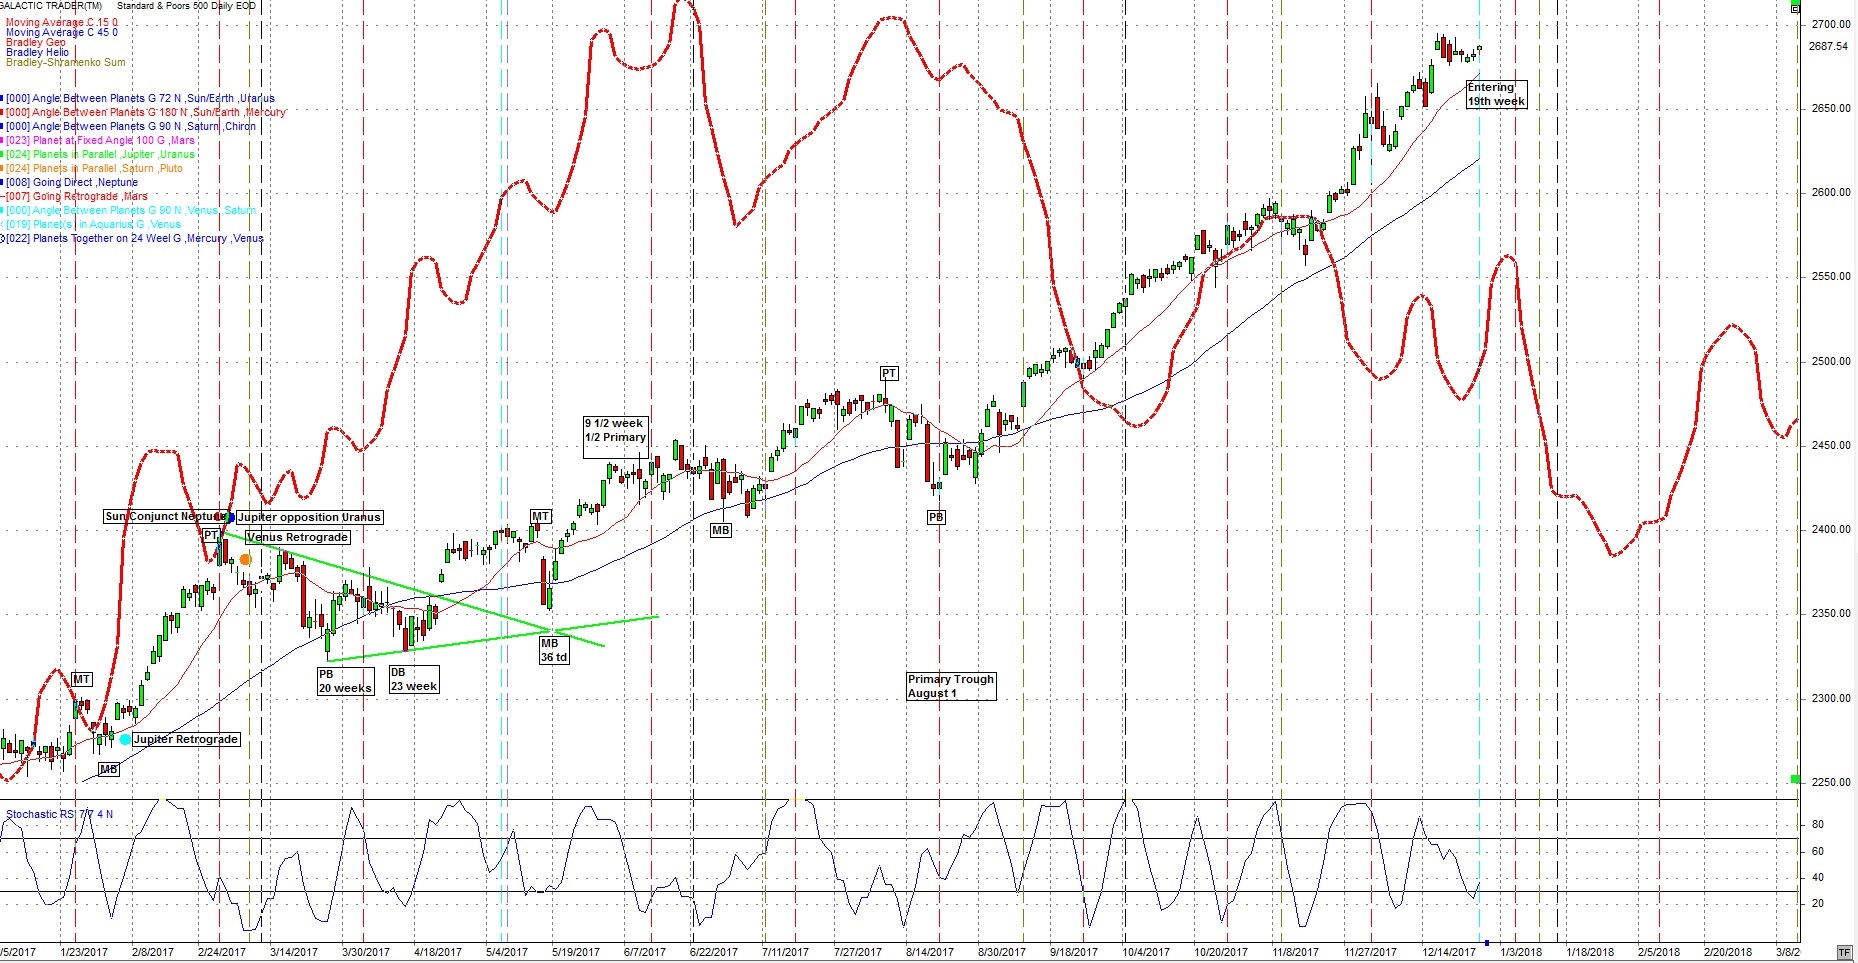
The following daily chart of the SP500 shows the Bradley indicator (thick red line). It indicates a possible change in trend near Jan 8.
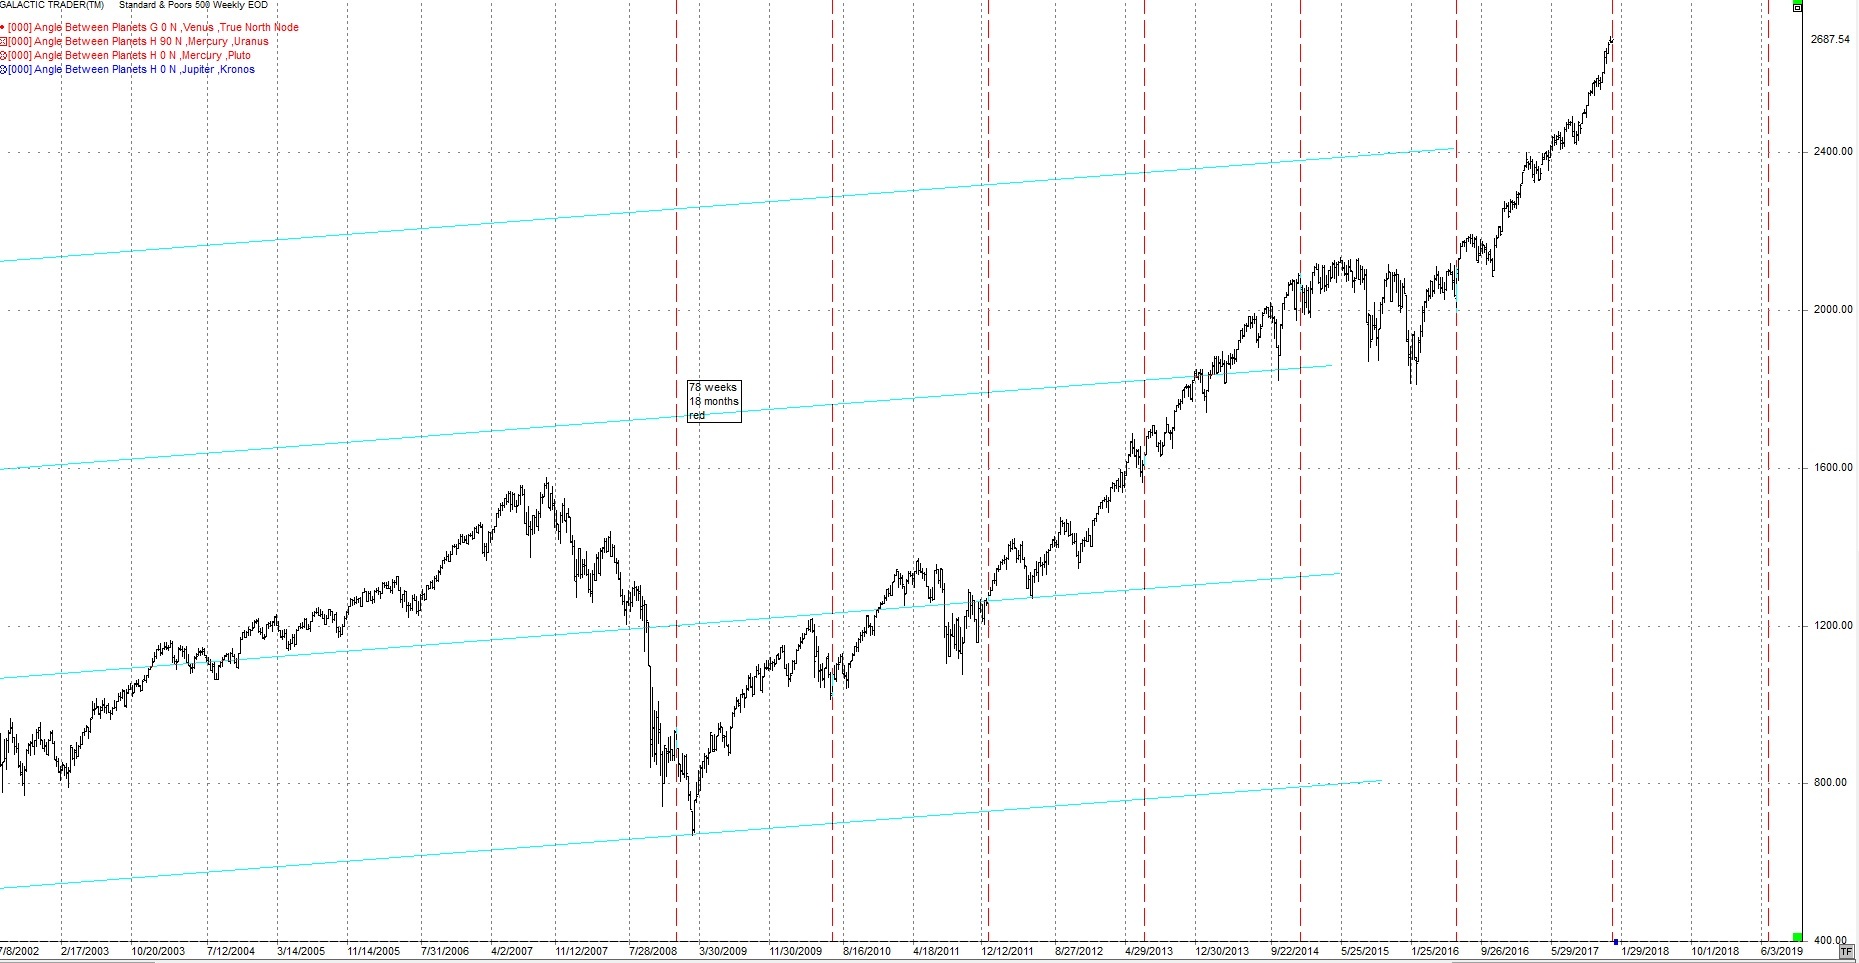
The 9/18 month cycle
The 5/10 week
Following up from last week we now have 4 planets in Capricorn, an Earth sign. Saturn is in Capricorn, the sign that it rules. Move carefully and with caution. Saturn is conservative in politics, practical and can exhibit limitation. This is a time to invest in new projects. The farmer and the miner are under Saturn’s influence. Saturn is a business planet which should be emphasized when Saturn joins Jupiter in a mutation conjunction in December 2020. Much more on this later. This coming year could see an increase in geophysical activity, both earthquakes and volcanos.
Whether it is central bank money, corporate buy-backs or money from some other source we need to know the time periods where a correction is more probable. We look at Cycles and Astro events that have a history of being 65% - 72 % correct. We will continue with this approach.
We should stay aware the trends in the major US indices remain up and that is the way they should be played although the following cycles indicate a change in trend is coming.
The 1st week in Janury 2018 has:
Jan 2 Uranus Direct – has a history of being close to a Primary cycle crest or trough.
Super Moon - violent weather and people
Mars squared the North Node – team work
Jan 5 Mars semi-square Saturn separated from work
The following week is busy.
Generally speaking the first couple of month of 2018 should be volatile. There are 2 Super Moons and 2 Eclipses.
Both eclipses are strong but the strongest should be the February 15 Solar Eclipse. This is almost opposite the August 21st eclipse last year. Both are in late Fixed signs. Remember all the violent weather we had after last years eclipse and the continuing aggression. More on this as we get closer.
In addition, Feb 8 has Pluto conjunct the heliocentric nodes of Pluto. This happens so slowly it needs a broad range of dates.
From last week
“Watch for news from or about France including countries with an influence from France like North Africa.”
There has been news out of Libya that they are selling slaves
The above combination, with Saturn, could be defining problems / restrictions for the general population, particularly the mature population and with the Sun could affect the President or other leaders. This combination could affect a number of years in the future as Saturn is in a sign for approx.. 2 ½ years. Other conditions this may highlight are State funerals, public sorrow and disappointment in general. State assets could be affected as well as industries connected to metals and mining.
The following monthly chart of the DJIA shows when Saturn has been in Capricorn (red x’s). Notice they have all had significant drops. This chart also has the 15 year cycle which will be coming due in 2018.
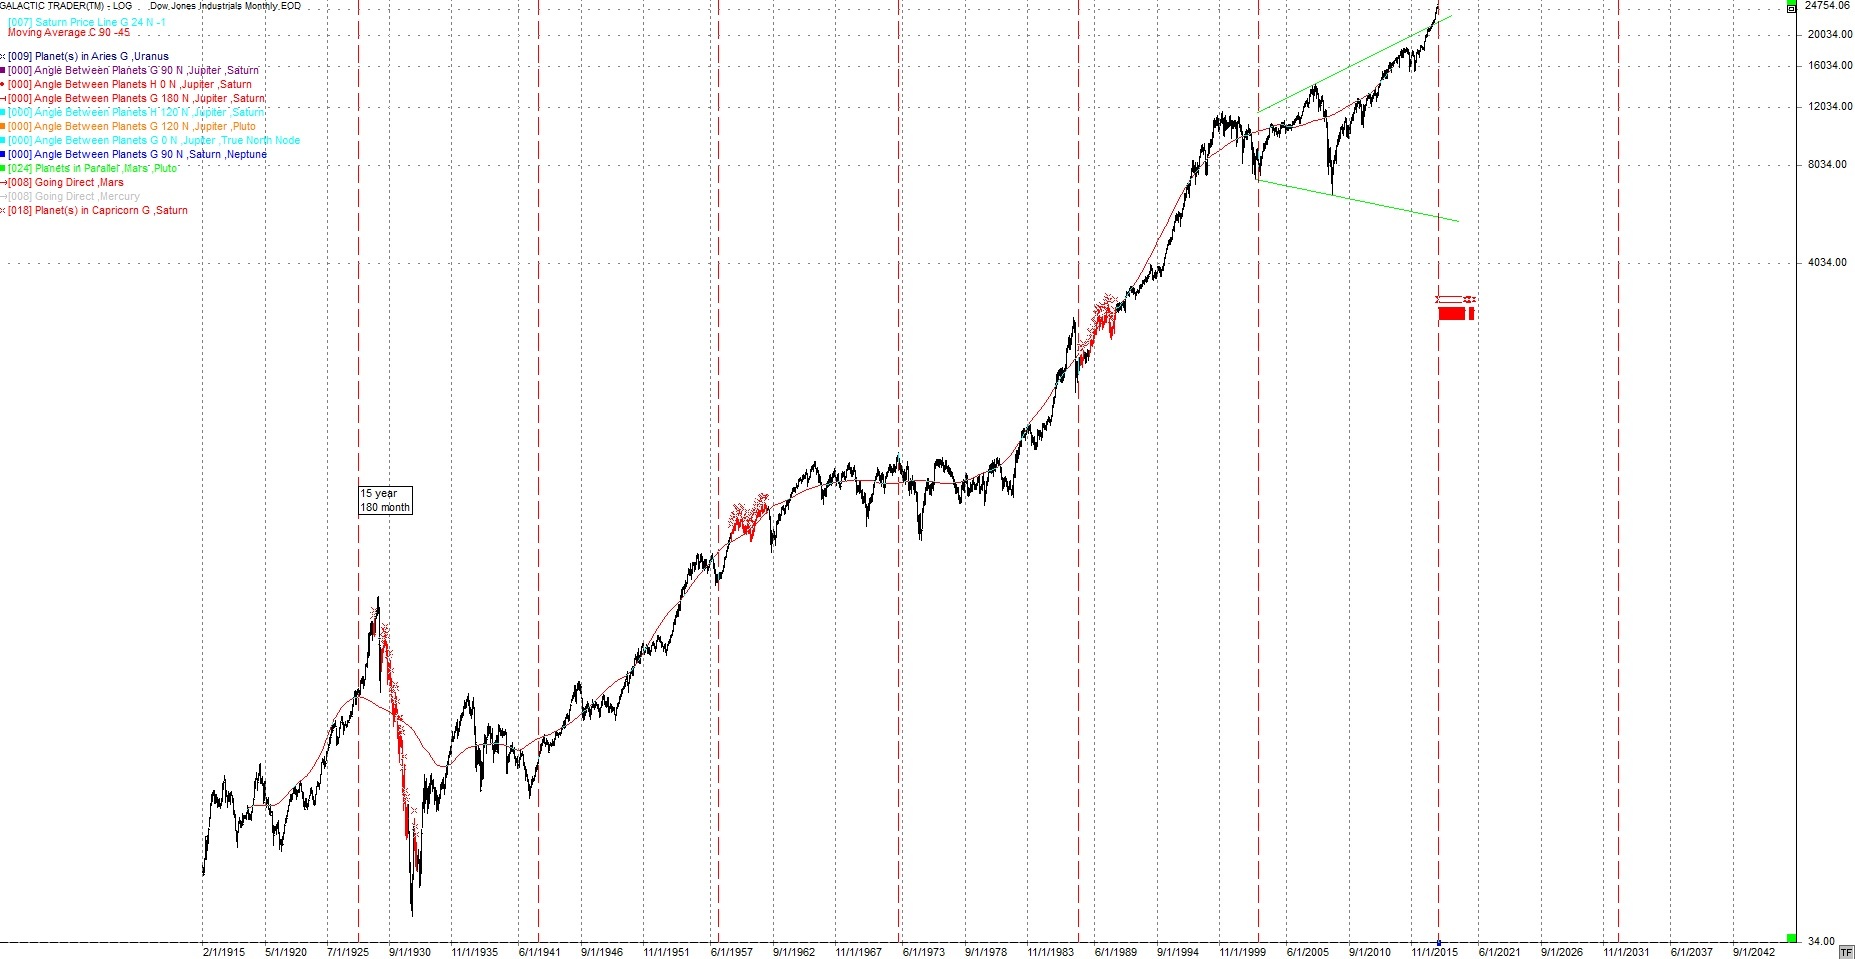
There could be some type of surprise coming in 2018 from the government or exposing something from the past. There could also be a major breakdown in world affairs or leaders.
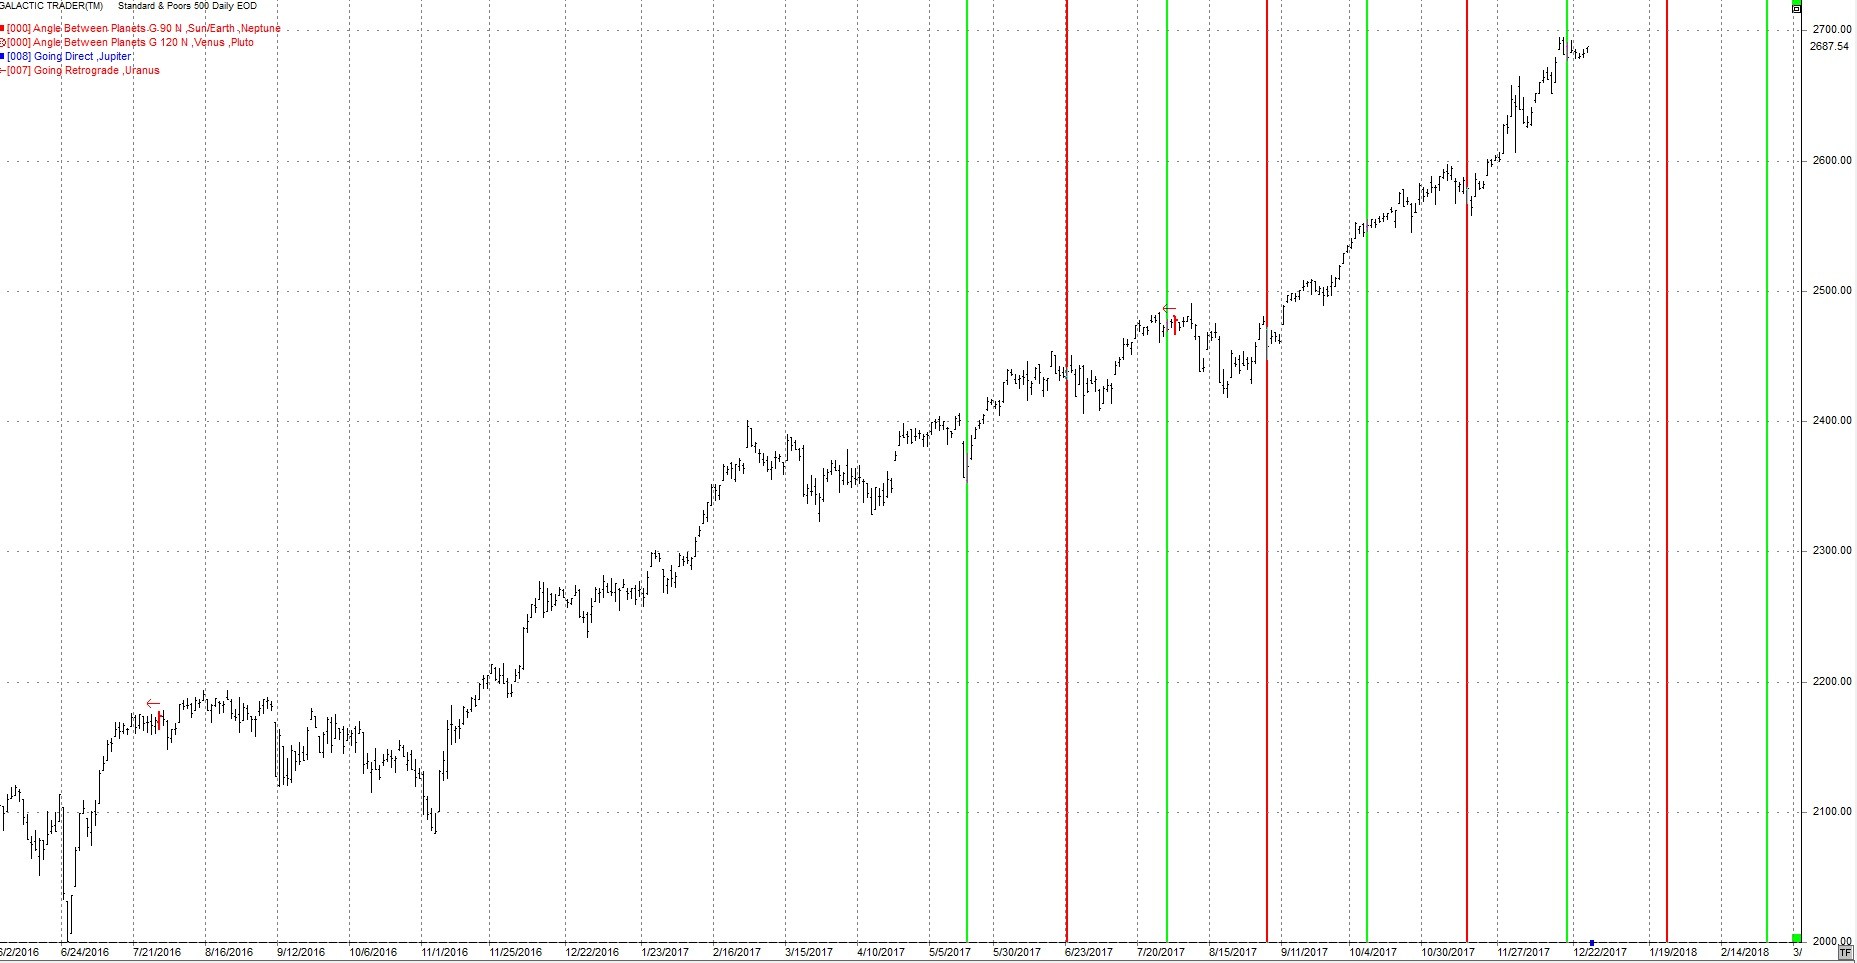
The following daily chart of the SP500 shows the Jupiter price line (blue) and the Sun/Earth price line (green). Both of these price lines have a history of providing support and resistance.
When the two lines cross we often see a big range day or reversal.

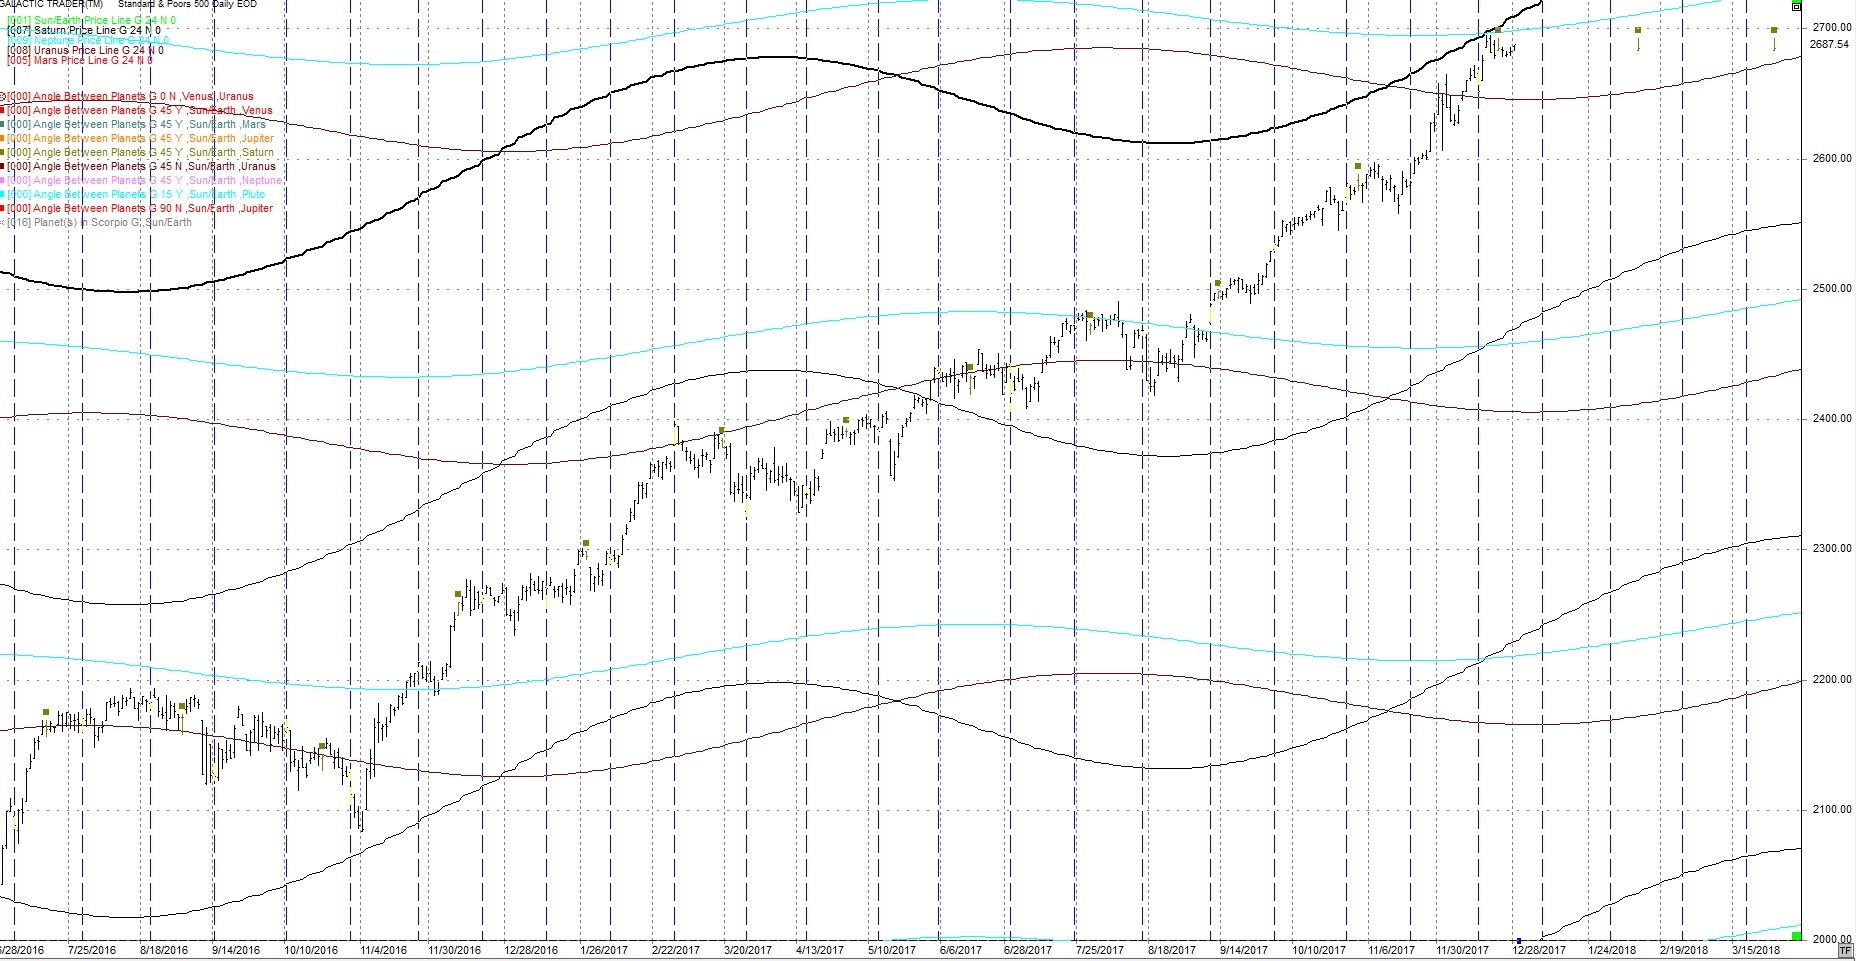
I continue to watch the 24th harmonic cycle (360 / 24) cycles for short term turns. The brown squares are Sun / Saturn 24 degrees on the following daily chart. The blue vertical lines are 24 cd’s (calendar days).
The next hit is Feb 9, 2018 and March 29, 2018. I have added 3 price lines to this chart.
- Saturn – black
- Uranus – purple
- Neptune - light blue
These price lines can act as support / resistance. It has been at highs and lows. Note also when they cross often gets a reaction in price on a short-term basis. Also note, near the top of the chart is a light blue line. This is the Neptune Price Line. Note how it has been strong resistance to price but has broken through. It should act as strong support when the market turns down.
Author

TradingDaze
Aisys Technologies Inc.
Gordon Lawson, aka TradingDaze, is a Canadian CPA, certified computer programmer and Astrologer. My traditional career spanned 25 years as a Financial Analyst at Suncor and Manager of Information Systems at BP Resources Canada. After this time Mr.


