SP500 Awaiting a Move Down

SP500
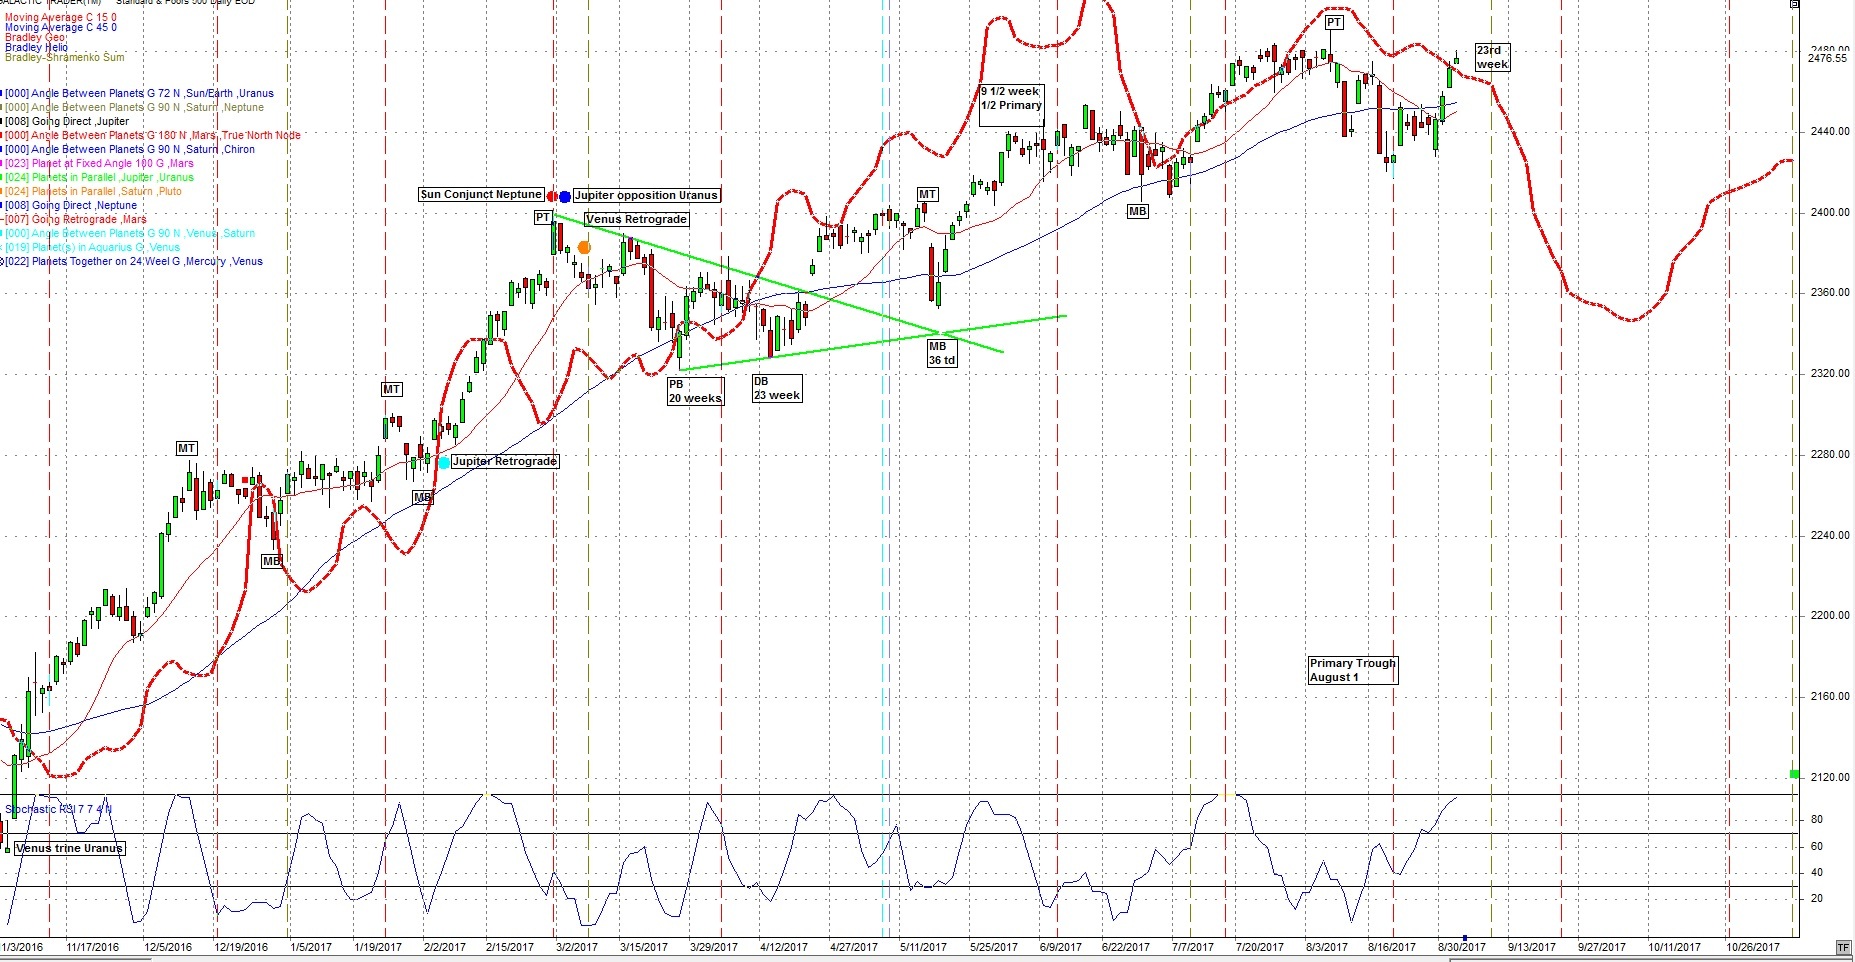
For the SP500, cycle-wise I’m looking at March 27th as the Primary cycle trough and April 13th as a double bottom.
This puts us entering the 23rd week of the Primary cycle. The SP500 may have put in the Primary cycle trough on August 18th. Note that price was below the 15 day and 45 datysma’s where we like to see it for a Primary cycle low. The 15 day is the ½ cycle to the 30 day (6 week) and the 45 day is the ½ cycle to the 90 day or 18 week. There were some longer term cycles due as well.
It should be pointed out we have had nuclear missile threats and one of the worst storms in memory yet still the markets have gone up. Some would say it’s a bull market others would say it is being manipulated. The truth probably includes both.
There may be other cycles about to move down into their cycle troughs, notably the 50 week cycle which often occurs close to the Saturn Direct signature. Saturn turned direct on August 25th. Other longer-term cycles may have the trough lower than normal.
If you review what were looking for from the Total Solar Eclipse I had mentioned violent weather as one item. Harvey was it, and now another possible storm in the gulf.
With the other cycles and Astrological events this may mark the end of the bull market that started in the lows of 2009.
There is a violent signature on September 3rd which may involve something from the past.
As suspected Trump has been very affected by the Total Solar Eclipse. North Korea, after the Total Solar Eclipse launched another missile. We had made the point last week that the Total Solar Eclipse could result in violent weather. Hurricane Harvey would be it.
Remember, like an Aspect between two planets we should give the eclipse an orb of influence. The rules are in the Subscribers report.
It may also affect Israel and possibly other countries and leaders that I have not found yet. I have mentioned Royals in other countries or the country leaders.
The following daily chart of the SP500 shows the Geocentric Bradley indicator (thick red line). It indicated a change in trend on August 8 and the SP500 started down. We won’t go straight down. The Bradley also a turn marked for August 18 and August 25th
Saturday August 12 Mercury turned Retrograde. This has a history of a change in trend and will be moving backward from August 12 to September 5th. This marks a period of possible confusion. This is not the time to be signing contracts or finalizing agreements of any kind. Mercury will join with Mars and both conjunct the point of the Total Solar eclipse on September 3. This should be powerful.
The following daily chart of the SP500 shows the key Mercury retrograde events. The red arrow pointed left is the Retrograde date. The small red circle and blue square is the Inferior conjunction of Mercury and the Sun. The blue arrow is Mercury turning Direct on September 5th. Note the price movement of these key dates on the chart. I expect volatility through September 5th and probably beyond.

Uranus will be semi square Neptune from mid-July through October. The last exact date was August 11th. This will be a longer period of delusion / deception. It may be more like a fog that has descended that is confusing. For the markets people won’t know what the direction will be. Among other things Neptune stands for water. Look for rain storms through October.
In the subscribers report we go more detail on the Total Solar eclipse and it’s potential effect on President Donald Trump. This covers the Saros cycle which traces this cycle back to the period of time John F Kennedy was assassinated, the Cold War and Cuba / US conflict.
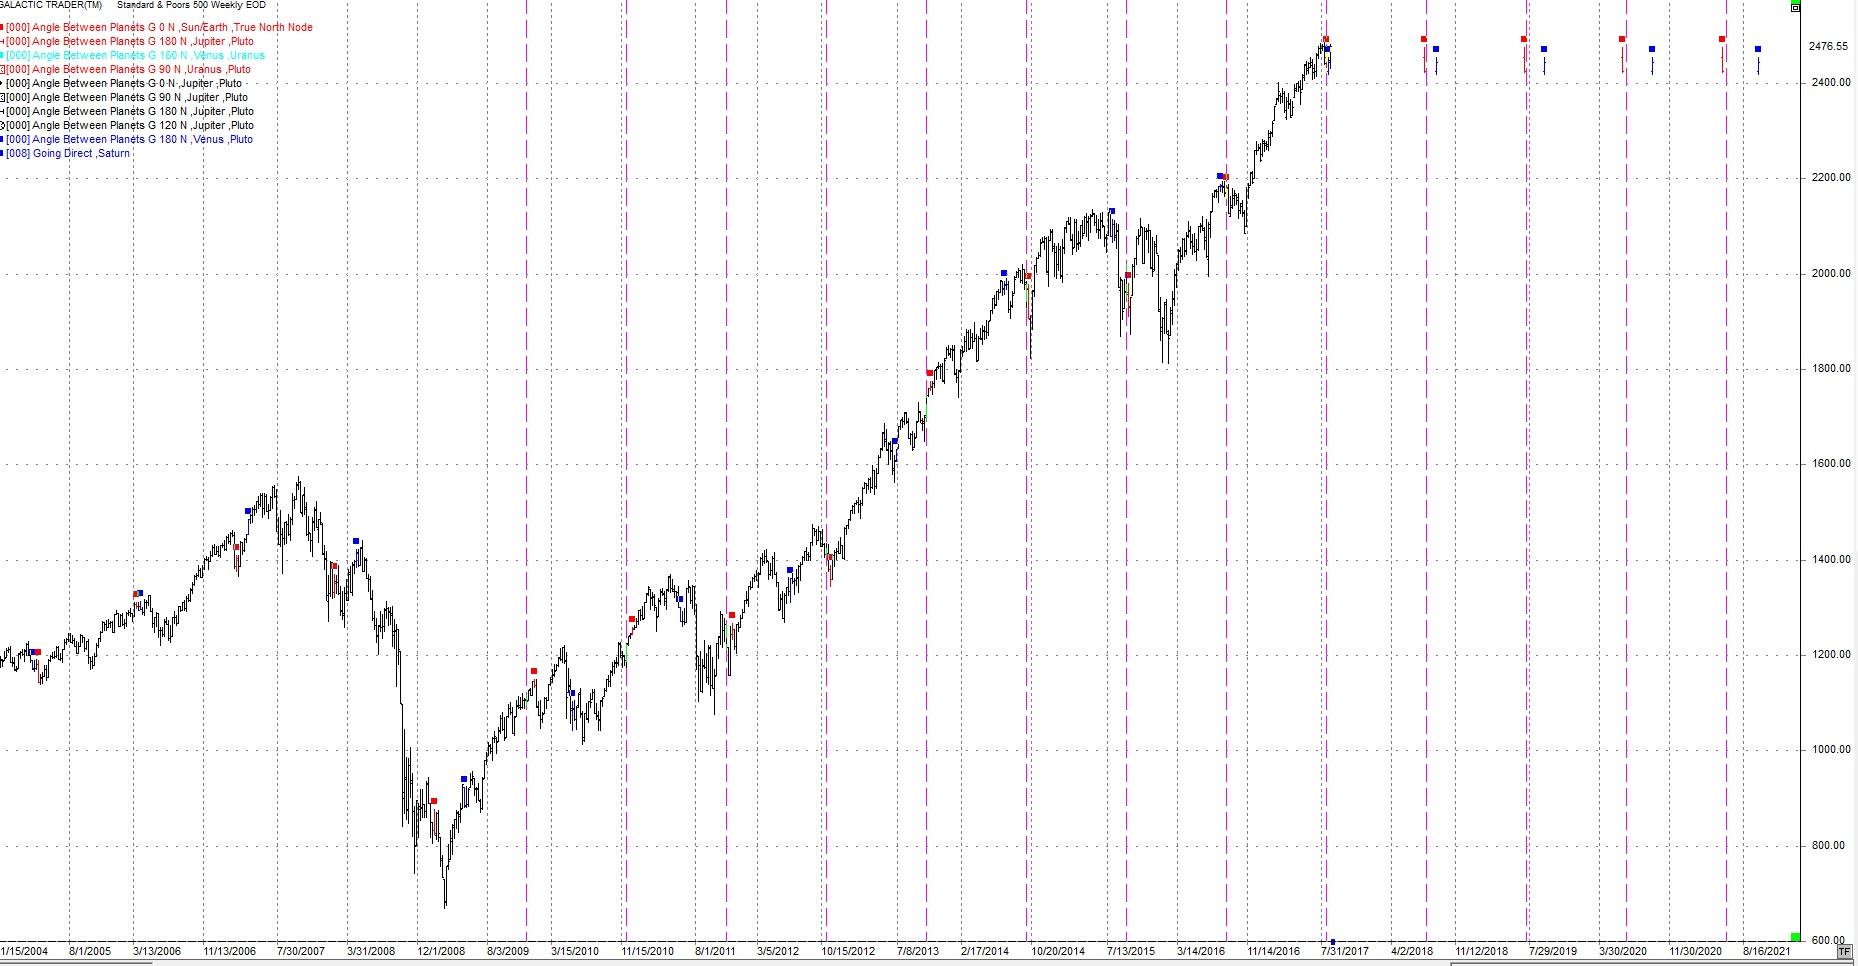
Another cycle that is coming up is the 50 week cycle. These are shown as the pink vertical lines on the following chart. The red squares show the Sun conjunct the North Node. There is a Sun North Node conjunction on August 16th. As I would expect a substantial decline, this time may be unusual in that the markets have been distorted by Central Bank money. The red squares are the Earth conjunct the North Node. Saturn Direct also has a history of occurring near a 50 week cycle. See the blue squares for Saturn direct.
We still have:
- the 45 year Saturn / Uranus trine Next due November 11
-The 12 year Jupiter / Pluto Square Last August 4 (Ill be taking this one out)
-The 14 year Jupiter / Uranus opposition Next due Sept. 28
These longer-term aspects need a broad orb and should be +- a few weeks at least. They have been described in the subscriber report. Note the Jupiter / Pluto waning square is often seen close to Primary cycle turns although there are not that many occurrences.
In addition to the above there is a potent transit between transiting Saturn square the USA natal Neptune. Hard aspects to the USA's Neptune and Mars often coincide with financial disruption. Saturn will square the USA Neptune and oppose it's natal Mars 3 times in 2017. January, July and October.
The effect of Saturn square Neptune is deflationary. With the buildup of credit in the economy the above aspects could bring on defaults, cash shortages putting stress on the credit markets.
The following weekly chart of the SP500 shows the 5 month (blue) and 10 month (red). The next 5 month cycle is September 4. The 5-month cycle often is at a low or the start of a slide down.

Sept 3 Mercury Retrograde conjunct Mars and both conjunct the point of the Solar Eclipse. War like aspect
Sept 5 Sun opposition Neptune (often a change in trend)
Beyond individuals or countries, the eclipse could indicate a strong earthquake, volcanic activity or violent weather. Remember Mars is the planet of war. As I write this Hurricane Harvey is entering Texas and North Korea has shot off another missile..
I continue to watch the 24th harmonic cycle (360 / 24) cycles for short term turns. The brown squares are Sun / Saturn 24 degrees on the following daily chart. The blue vertical lines are 24 cd’s (calendar days).
June 29th, July14th and Aug 29 were big range days.
The next hits are Sept 13 then Sept 13th.
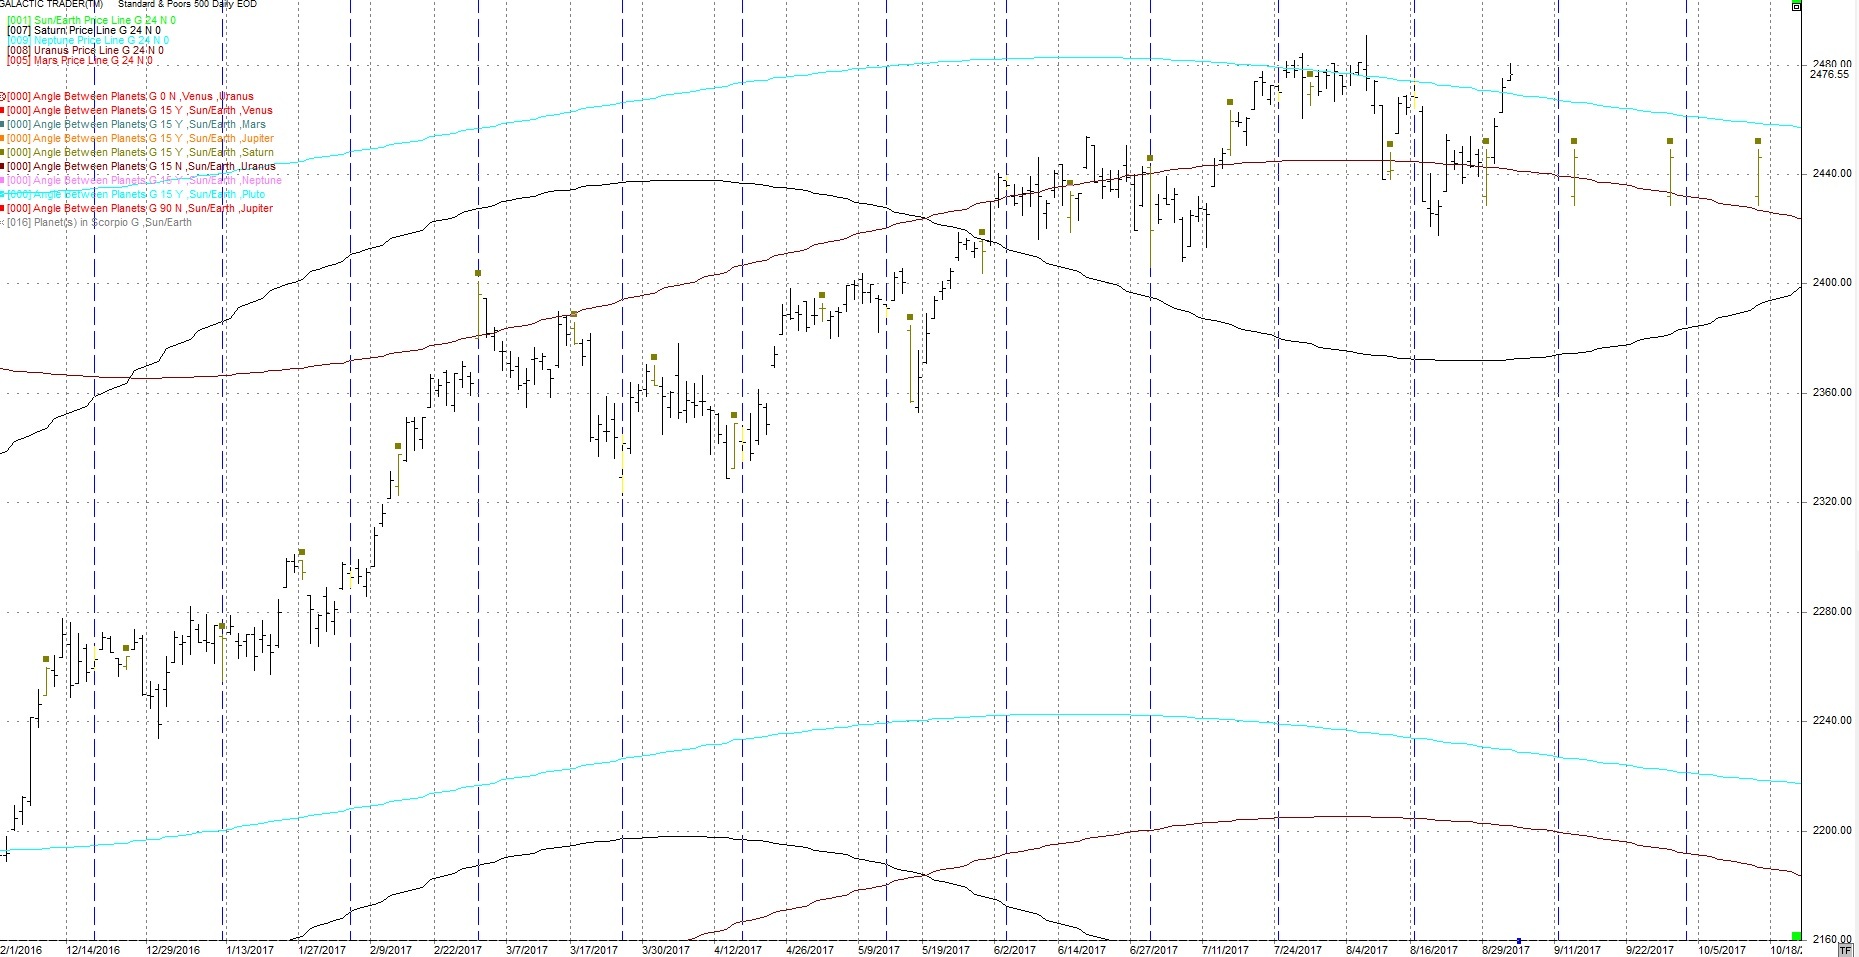
I have added 3 price lines to this chart.
Saturn - black
Uranus - purple
Neptune - light blue
These price lines can act as support / resistance. It has been at highs and lows. Note also when they cross often gets a reaction in price on a short-term basis. Also note, near the top of the chart is a light blue line. This is the Neptune PriceLine. Note how it has been strong resistance to price but just broke through. I’ll be surprised if price stays above the Neptune priceline.
The next dates are: Aug 29th and Sept 13th
Author

TradingDaze
Aisys Technologies Inc.
Gordon Lawson, aka TradingDaze, is a Canadian CPA, certified computer programmer and Astrologer. My traditional career spanned 25 years as a Financial Analyst at Suncor and Manager of Information Systems at BP Resources Canada. After this time Mr.


