SP500 "A move up"

Summary
SP500. Volatility continues. I’m looking for a move up early next week. The two Neptune Astro events appear to have resulted in a double bottom also known as a “W” bottom.
Review the daily chart of the SP500 further down. Other things that can affect the markets are interest rates. The FOMC announcement on Dec 19 is important as is their outlook on rates going forward. Remember Jupiter is now in Sagittarius which may have an inflationary effect. All things legal and the courts should start to have more of an effect. These same two Astrological events may have a positive an effect on crude as well.
Gold is still under the effect of Mars entering Pisces om Nov 15th. Nov 19 has Mars square Jupiter. The Venus opposition to Uranus on Nov. 30 has a strong history of moves in Gold. On the Gold chart we have just put in the 3rd, 6 week low in the Primary cycle. I’ll be looking for a Primary low in 5 to 6 weeks. The last 6 week of a Primary cycle is often the most volatile.
Crude's Primary cycle appears to have shorten a bit. I was still looking for a low in Crude around either Nov 24 where Neptune is Direct and watch, Dec 5th the Sun is in waning square to Neptune. The Saudi’s are producing record amounts causing a glut in the market and lower prices. Crude looks like it could go lower.
SP500
The last Primary cycle trough started on June 28, 2018 and may have completed it’s Primary cycle trough on Oct. 29, 2018. Please note, this is not definite and we could have a secondary pull back so the Primary cycle trough is not firm yet. Markets should continue to be volatile next week. As noted above we often see a double bottom when Neptune turns Direct.
If that was the Primary cycle low then we are beginning the 5th week of a new Primary and getting close to a 6 week low.
We don’t want to see a close below Oct 29 low or worse below the Feb 9th low We are still in a period of volatile congestion.
The recent move down was timing the 18-week Primary cycle and a 2 year cycle. The longer term cycles (2 year) can distort the smaller term cycles (18 week).
September 21 seems to be the crest of the last Primary cycle and may be the high for the
4 year cycle.
The following dates may have significant moves or start a move. The following aspects are for a reverse in trend or large range day. volatile week.
Nov 30 Venus opposition Uranus
Most often a signature for a trough +- 7 tds.
Dec 2 Venus inters Scorpio
Dec 5 Sun waning square Neptune
More often a trough than a crest.
Dec 6 Mercury Direct
End of unpredictable period.
Dec 7 Mars conjunct Neptune
Rejection, denial, destruction, infection, rumours
As usual dates are a minimum +- 3 tds unless otherwise noted. On longer timed aspects a time frame will be included.
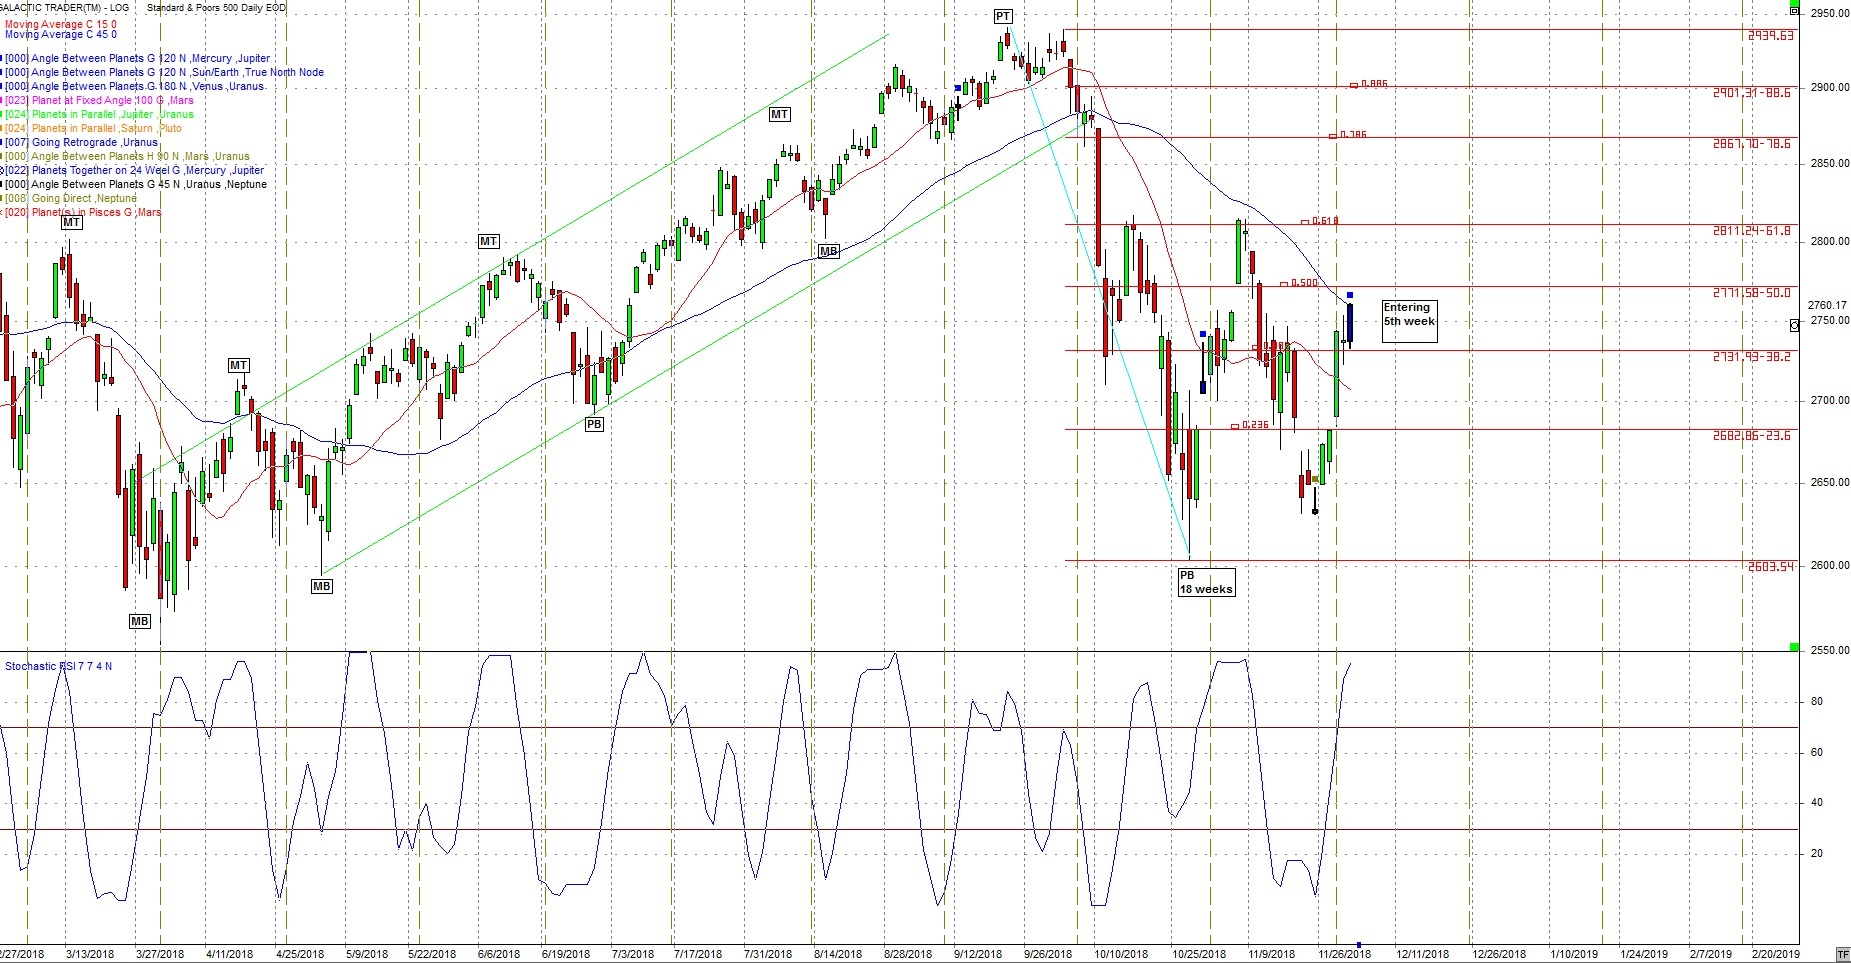
Price is now above the 15 sma and price is almost on the 45 sma. Neptune, together with Jupiter which are the ruling Planets for crude should effect the first week in December.
Note: from last week.
The low of the day on Nov 9 was exactly on the 23.6% retracement. Notice we have a number of gaps. They are on the SP500, DJIA and Nasdaq. Gaps tend to be filled meaning the markets would have to move lower at some point to fill the gaps.
Those Gaps have been filled
The following daily chart of the SP500 is what we have been showing under the 24 Harmonic chart. This is the basis of what we have been forecasting on.
Following is the 24 Harmonic chart we have shown for many months.
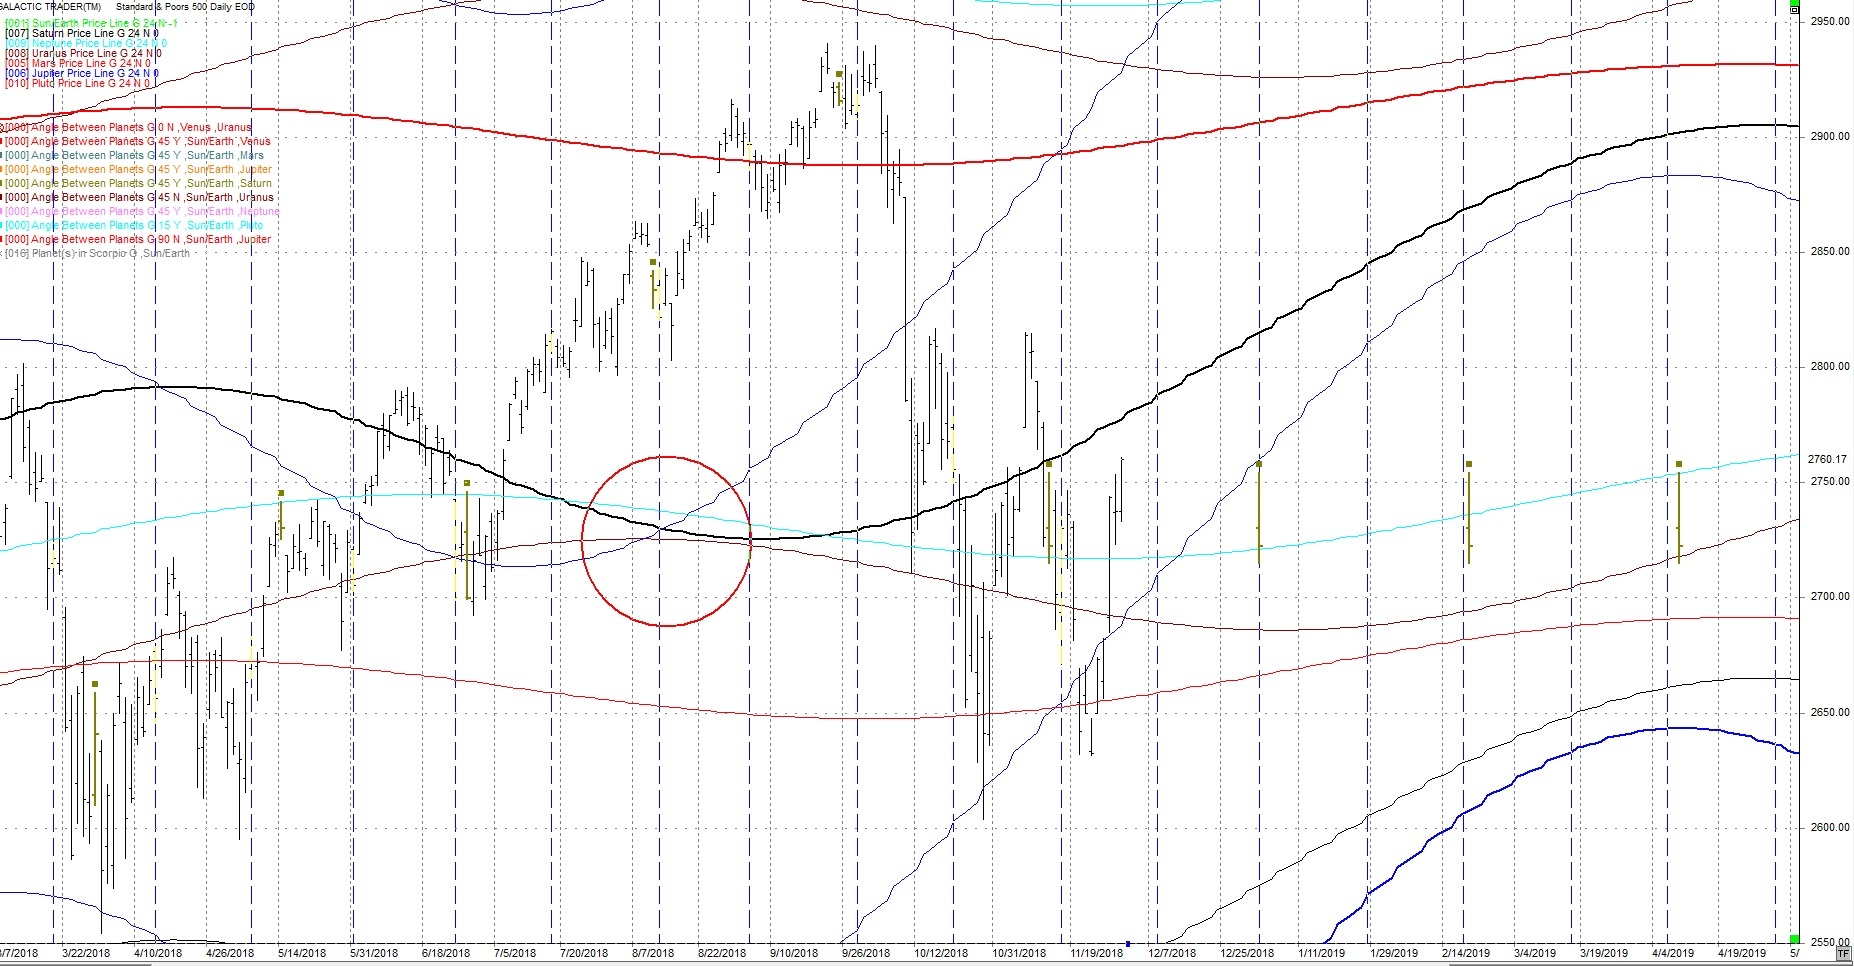
The next hits are Jan. 2, 2019 and Feb 20, 2019. The latter number is on the Uranus price line. Watch closely.
The 9 month cycle
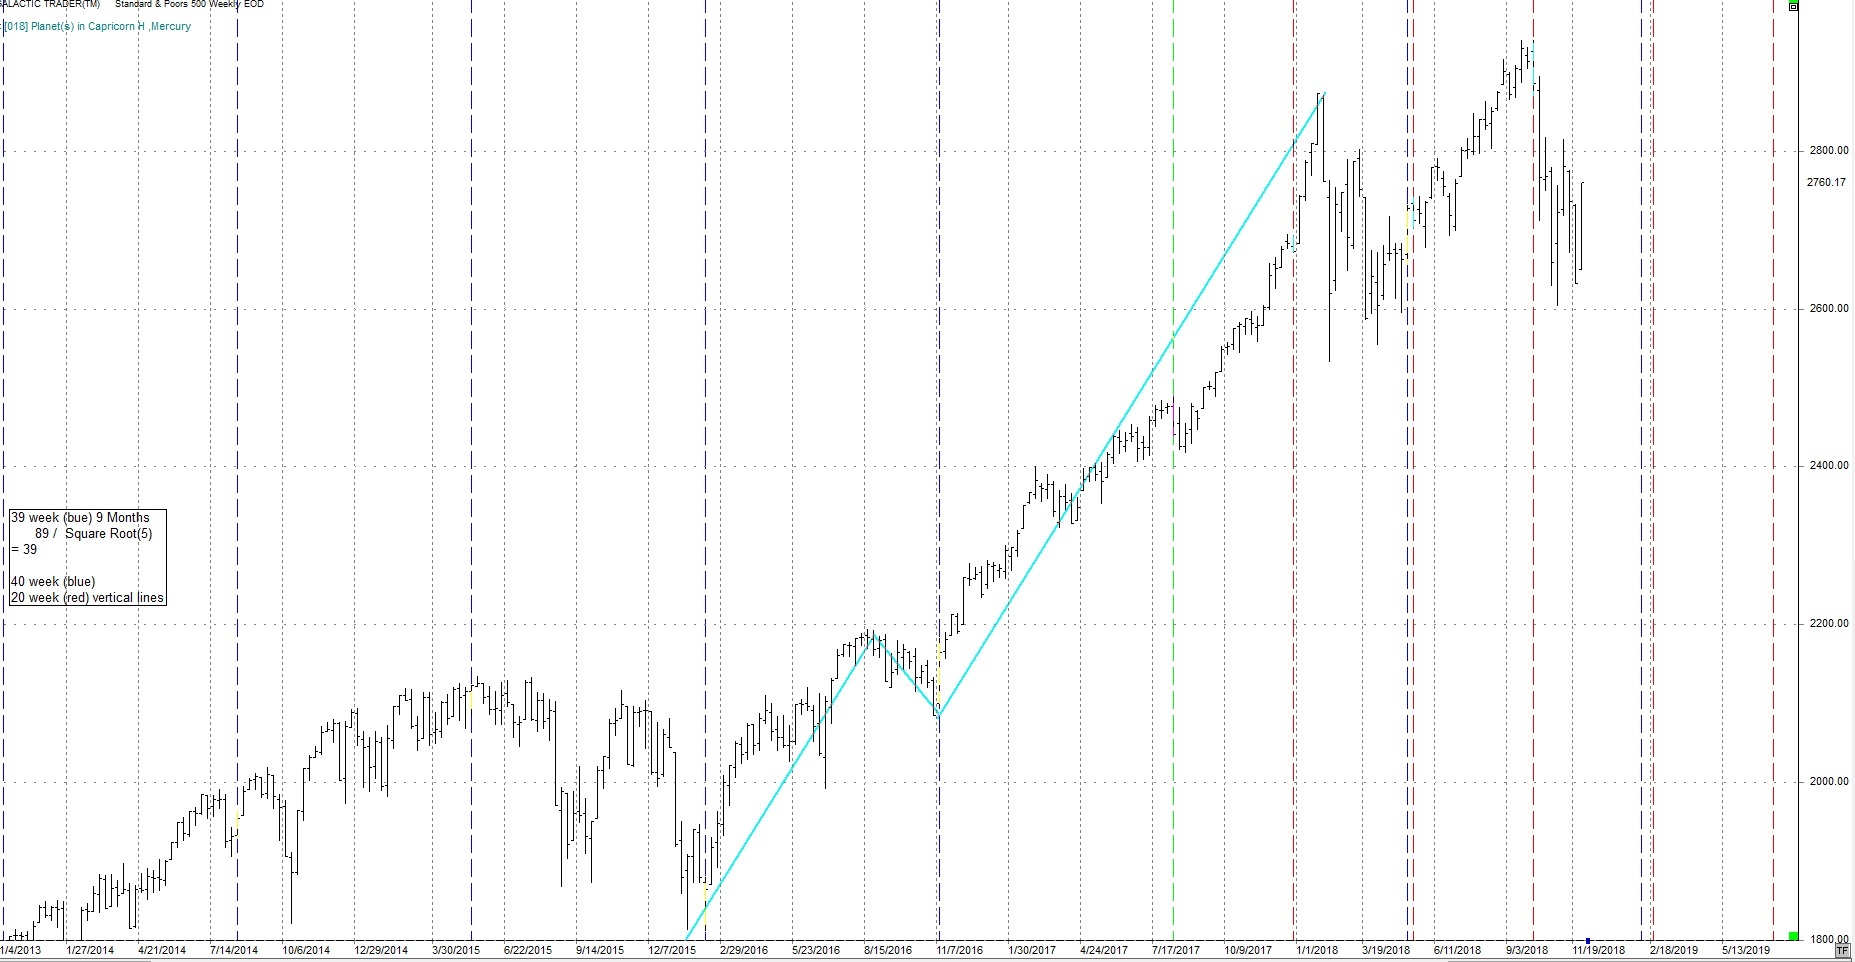
The above chart shows the 9 month or 39 week cycle (blue vertical lines). It was due and appears to have formed in late October. The 20 week cycle was added as well (red vertical lines). Any green lines are a combination of the 20 and 40 week cycles. The 20 week cycle was only 1 day away from the sharp move down.
The next 40 week cycle is early February 2019.
From the last few posts:
“This coming year could see an increase in geophysical activity, both earthquakes and volcanos.”
See the link under “Earthquakes”. This is an application from the USGS. There was a significant earthquake in Alaska today.
There has been a number of volcano’s erupting as well. Japan and Hawaii.
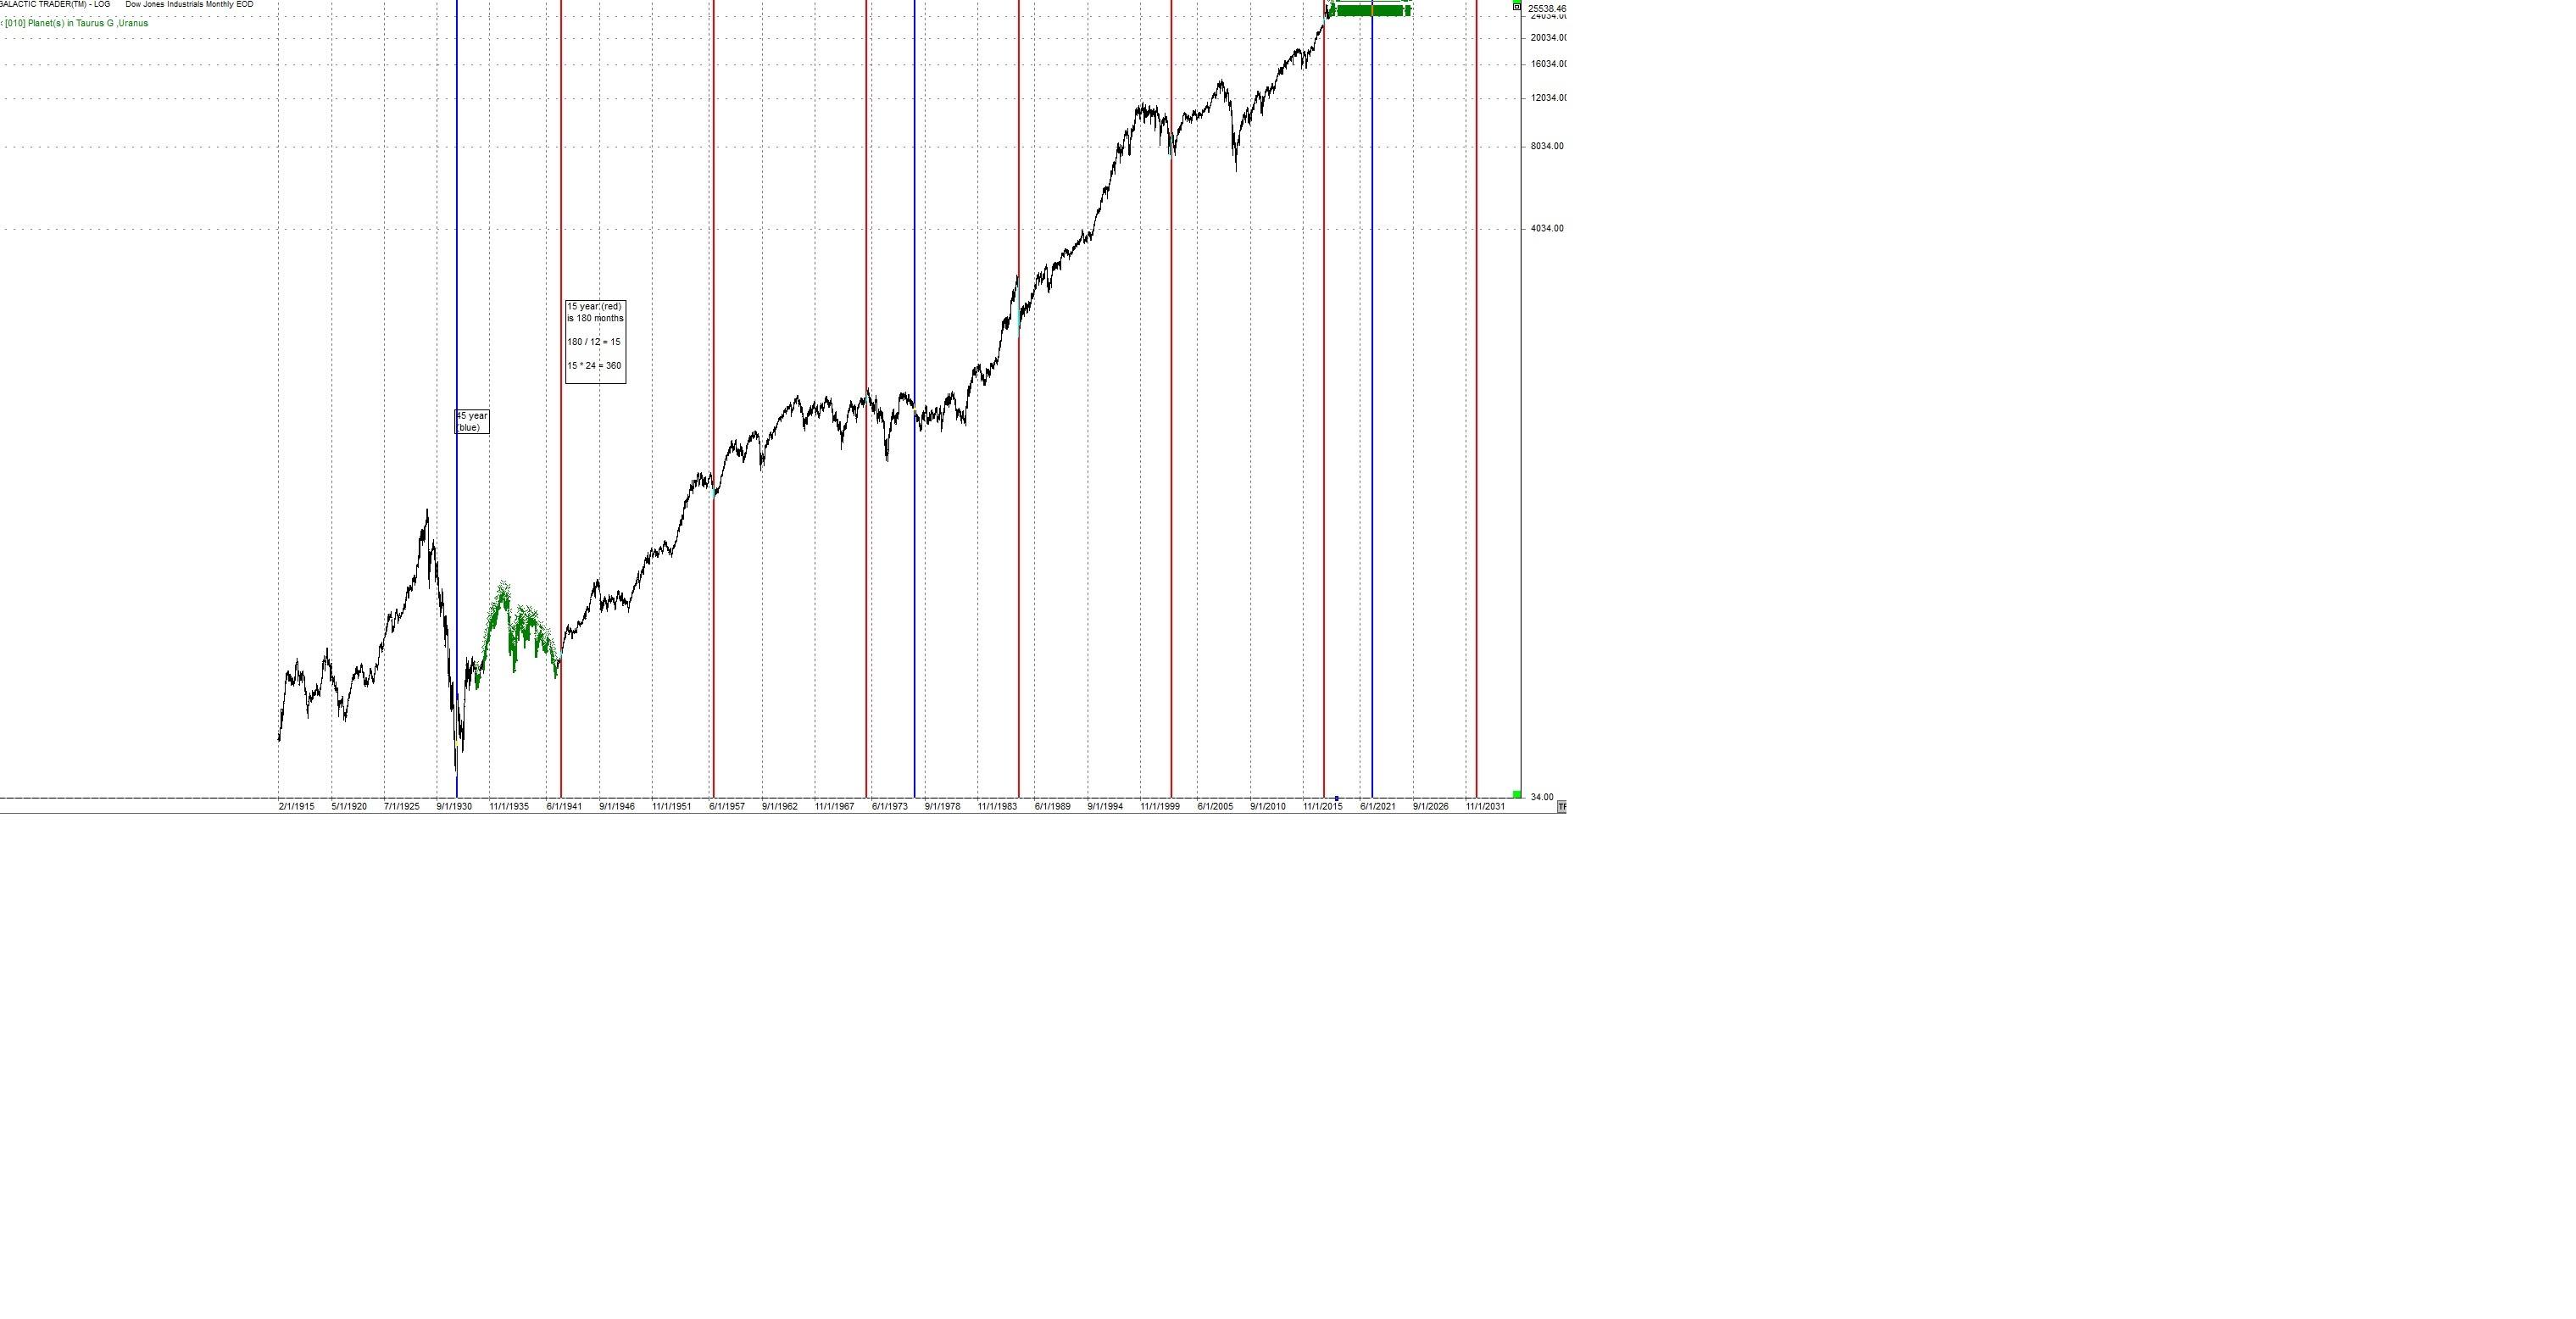
On a longer term basis the following monthly chart of the DJIA shows the 15 year cycle (red vertical lines) and the 45 year cycle (blue lines). The 15 year is due now or took place April – June 2018. The 45 year due in Sept 2019. This is another example of a longer-term cycle possibly distorting shorter term cycles. Bear in mind they need a broad orb.
The following daily chart of the SP500 shows 2 Envelope channels. Red is the centered
20 week envelope channel. Blue is the centered 40 week envelope channel. The dark blue squares are the Sun / Neptune square which is often a short term change in trend.
We have had this noted it was due for a sell. Also note the dark blue squares. They are the dates of the Mars square Uranus transit.
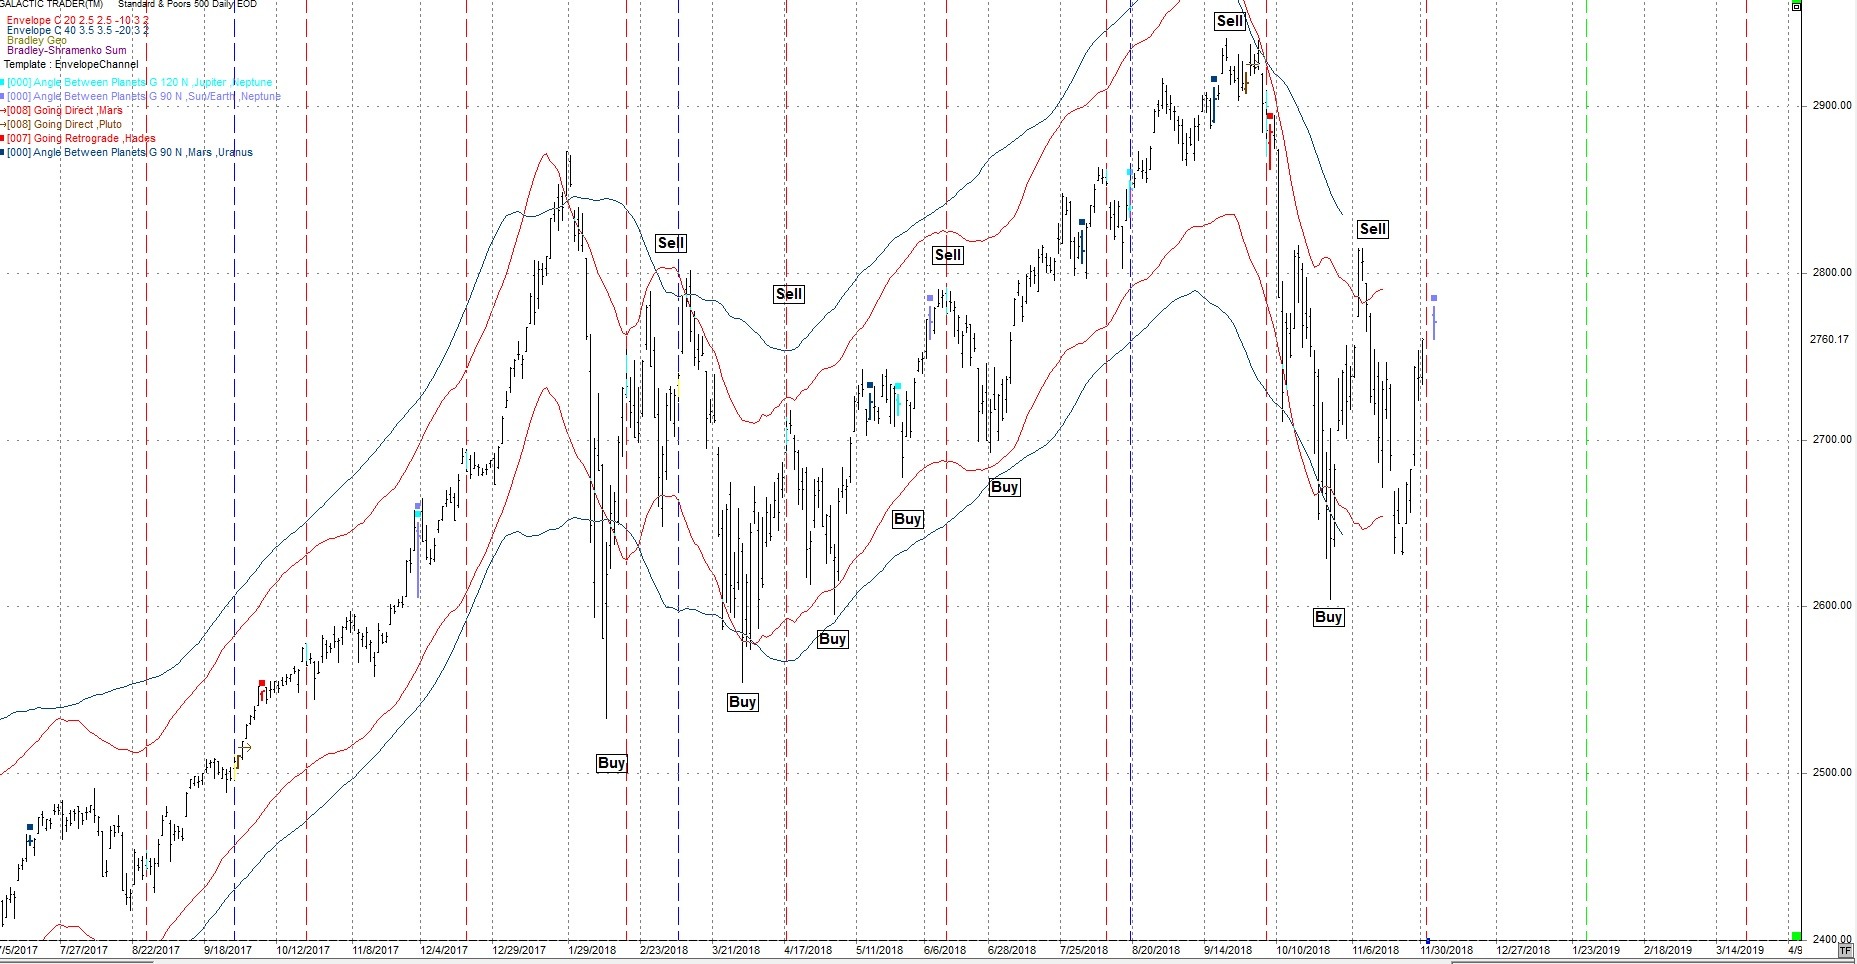
We are entering the difficult time mentioned over the last few months.
The envelope channel charts are easy to calculate. In the above case the blue lines are based on a 40 day average but when they are plotted they are centered. For a 40 day it will be shifted by 20 days which is the ½ cycle.
The red averages are based on the 20 week so they are shifted 10 weeks or a ½ cycle.
I brought up Iran on the last post. I’ll come back to those charts on any potential signs of conflict. It is getting close. Watch the news for problems with Iran.
4 Year
Other longer-term aspects like the 4 year cycle are coming due. The SP500 4 year cycle should be due in mid to late 2019.
The Primary cycle top on Sept 21, 2018 at 2490.91 may have been the top for the 4 year cycle. This is not confirmed.
Other
Another very long term cycle, the 90 year, is potentially around 2022 +- a lot. More time is needed to confirm this cycle. The ½ cycle to the 90, the 45 year ties into the 90 and is due in the same time frame.
Author

TradingDaze
Aisys Technologies Inc.
Gordon Lawson, aka TradingDaze, is a Canadian CPA, certified computer programmer and Astrologer. My traditional career spanned 25 years as a Financial Analyst at Suncor and Manager of Information Systems at BP Resources Canada. After this time Mr.


