SP500 A Dip

SP500
For the SP500, cycle-wise I’m looking at March 27th as the Primary cycle trough and April 13th as a double bottom.
This puts us entering the 12th week of a new Primary cycle. Instead of a nominal 6 week cycle I’m looking at the other possibility which would be a ½ Primary cycle (9 ½ week) cycle high.
From last months subscriber letter.
“I’m looking at two possible paths going forward.
-
A low in April, then a bounce and then down into June / early- July.
-
Down in April which continues down into June / July”
Option 1 seems to be unfolding with the low in April 13th and now new all-time highs and looking for a turn.
Jupiter turning Direct on June 9th then Neptune turning retrograde on June 16th seem to usher in a period of confusion.
Uranus will be semi square Neptune from mid-July through October. This will be a longer period delusion/deception. It may be more like a fog that has descended that is confusing. For the markets people won’t know what the direction will be. A more precise description will be made available once we go through the changes associated with the Astrological aspect in late July and mid-August.
Next week may be fairly quiet as there are no new major Astrological aspects. We could still get some follow through from the Sun/Saturn opposition on June 15th and Neptune turning retrograde on June 16th.
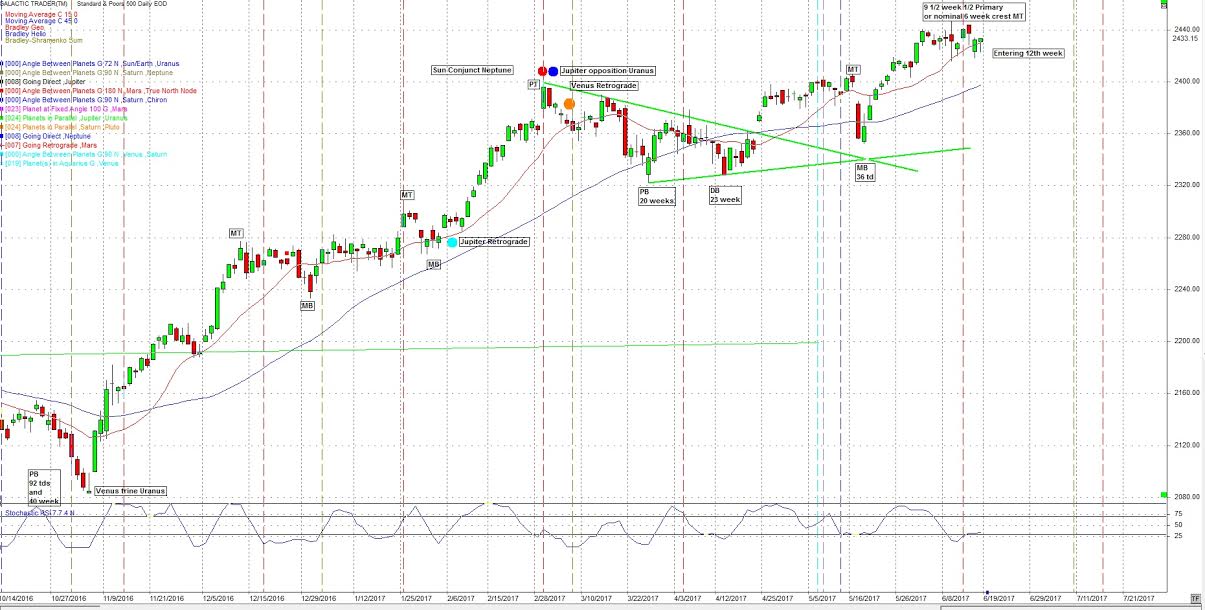
Note the 15 (red) sma and 45 day (blue) sma are both below price but moving up.
The last week of the month should be more volatile as there are a number of more potent Astrological signatures.
We still have:
The 45 year Saturn / Uranus trine Next due November 11
The 12 year Jupiter / Pluto Square Next due August 4th
The 14 year Jupiter / Uranus opposition Next due Sept. 28
These longer-term aspects need a broad orb and should be +- a few weeks. They have been described in the subscriber report.
In addition to the above there is a potent transit between transiting Saturn square the USA natal Neptune.
Hard aspects to the USA's Neptune and Mars often coincide with financial disruption. Saturn will square the USA Neptune and oppose it's natal Mars 3 times in 2017. January, June and October.
The effect of Saturn square Neptune is deflationary. With the buildup of credit in the economy the above aspects could bring on defaults, cash shortages putting stress on the credit markets. Any signs of deflation or defaults should cause the central banks to print. Inflation is quite possible.
We had a descending triangle (green) on the chart. As often happens price crashed through the upper line of the triangle, in effect gapping twice. Those gap areas may act as support. Note price moved down and bounced close to where the arms of the descending triangle met.
I’m expecting volatility with both ups and downs but moving forward I’m looking for a low probably late-June or July. after reviewing the Astrological aspects, although it could be as late as August.
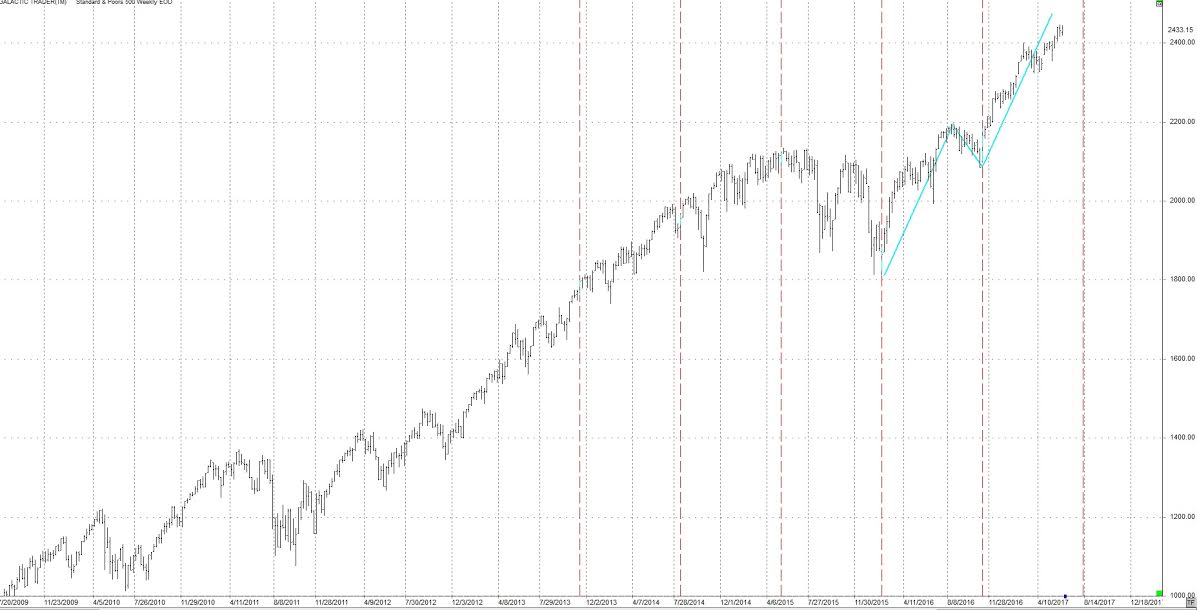
The following chart shows the 9 and 18 month cycles. The red vertical lines show the
9-month cycle. Every 2nd line is the 18-month cycle. Note that two cycles ago (the 18 month) was much deeper.
The blue line is a flag formation which is pointed to 2475.
The next 9/18 month cycle is early August but this needs a broad orb and could occur in July. If this is marking a low nearby the market would have to turn down in the next few weeks to be in a position to put in a trough in late July or early August. The Primary cycle is also due in early August.
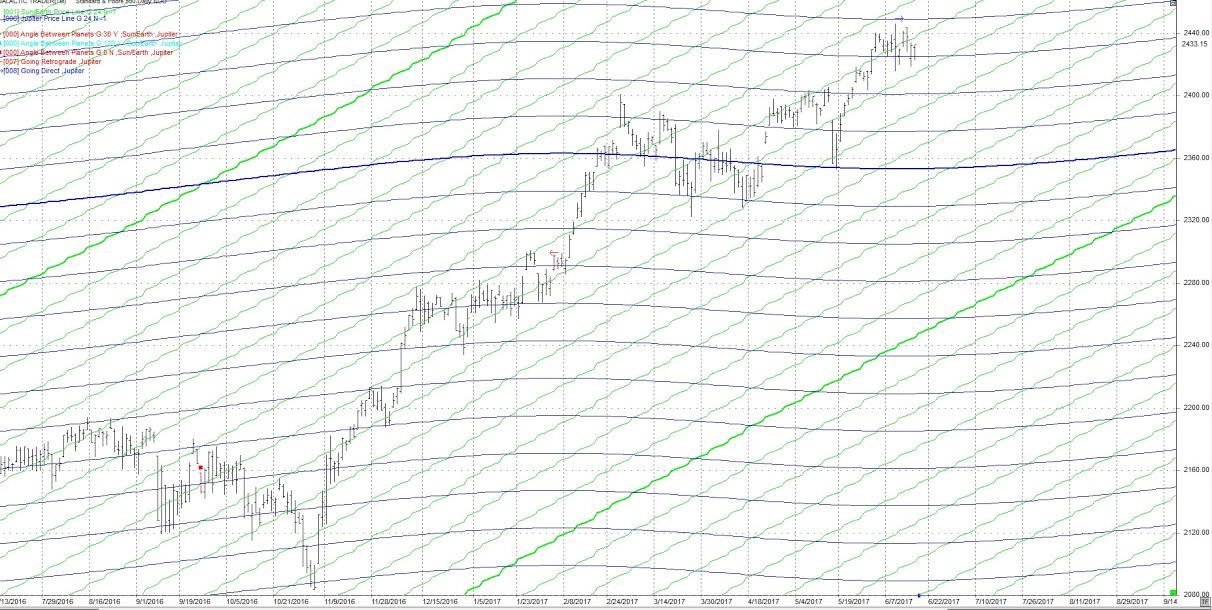
The following chart shows the price line for the Earth and Jupiter. The price line takes the longitude of the planet and converts it to price. The Earth price line is green and the Jupiter price line blue. Note they both have acted as support and resistance. Also, the markets often make sharp move when the two price lines cross. I’m watching to see if 2450 holds. That’s the price line for Jupiter.
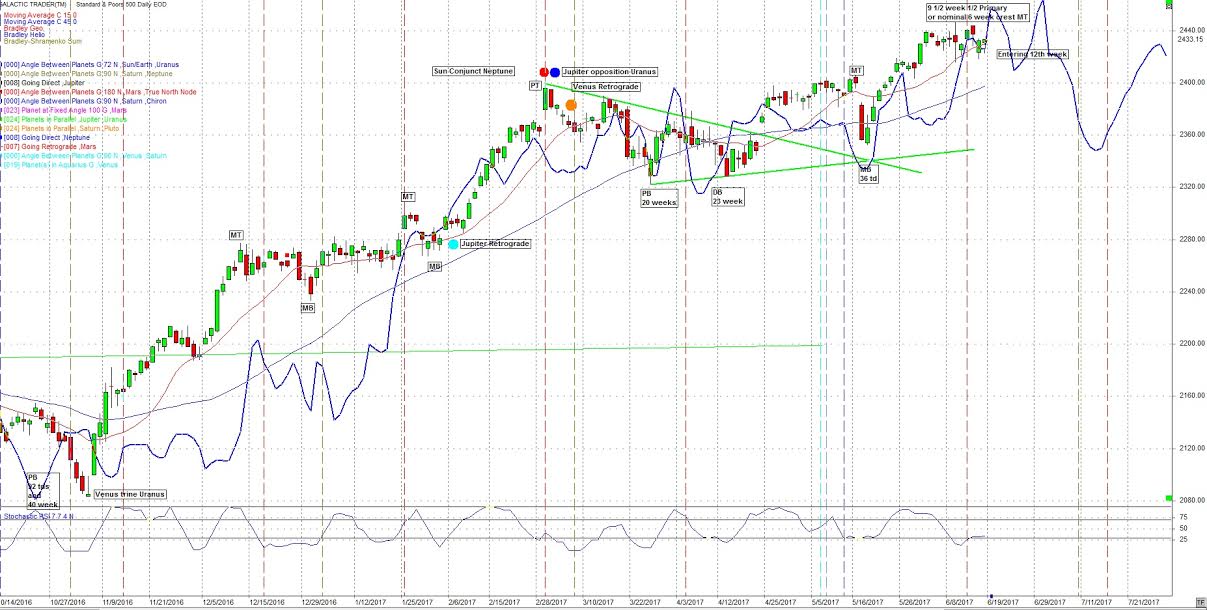
The following chart of the SP500 includes the heliocentric Bradley indicator (blue line). There are two possible change in trend dates are June 19 and June 23.
We should also keep in mind the 50 week cycle, last hit was June 27, 2016 and would be due late June or July. July in particular has a number of heavy transits which could be pointing to a 50 week cycle trough.
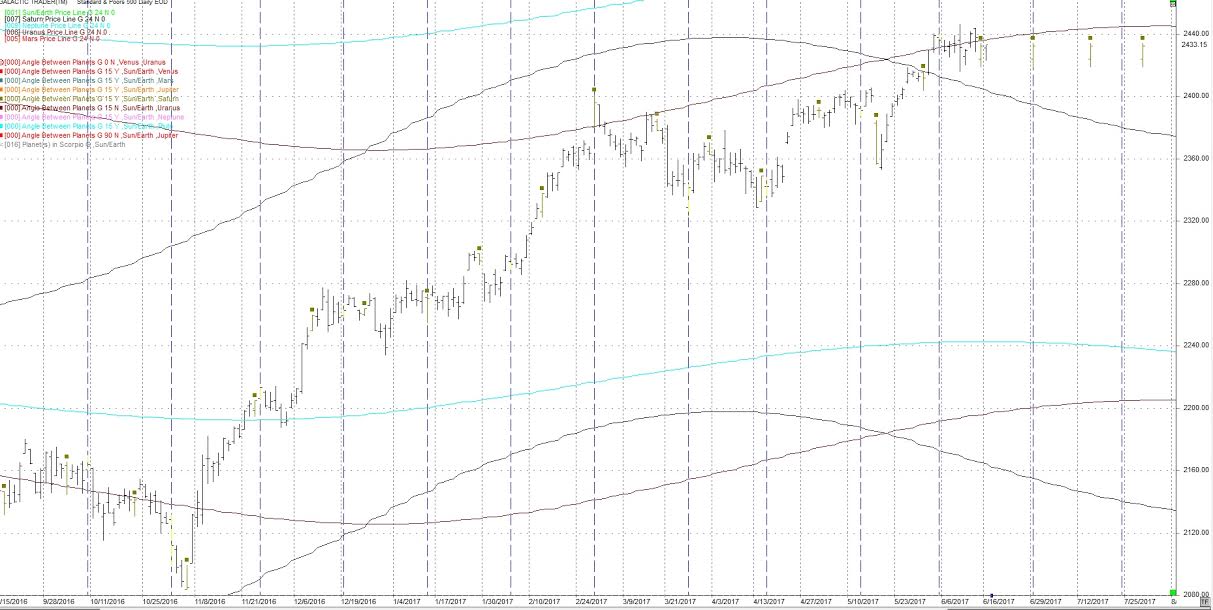
I continue to watch the 24th harmonic cycle (360 / 24) cycles for short term turns. The brown squares are Sun / Saturn 24 degrees on the following daily chart. The blue vertical lines are 24 cd’s (calendar days).
The next hits are June 29 which is on the 24 cd cycle. The latter could start a change in trend. The necx hit is July 14th.
I have added 3 price lines to this chart.
Saturn - black
Uranus - purple
Neptune - light blue
These price lines can act as support / resistance. It has been at highs and lows.
May 12 was the day the general population became aware of the Cyberwar that's been going on for some time. Note the references to May 12th above and the Mars waxing square to Neptune on May 11th.
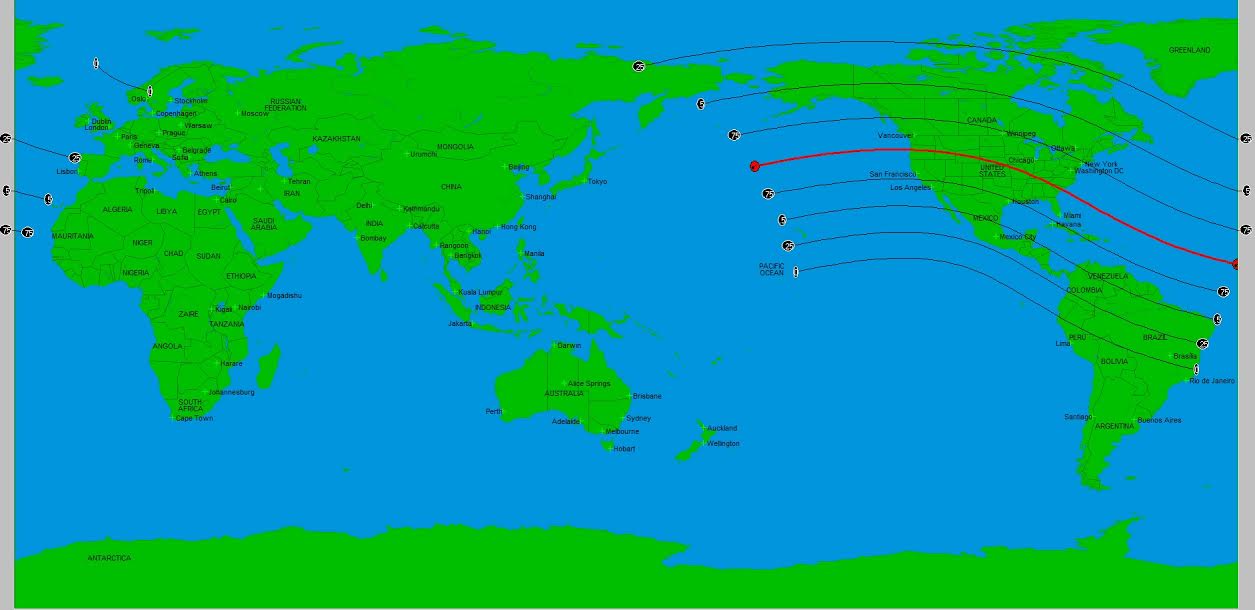
I brought up the August 21 Solar Eclipse in the May market letter. This should bring significant events in that time frame. In the mean time, I will monitor transits that may hit the location of the Solar Eclipse. An example in this blog is May 15th when the North Node transits over the point of the eclipse.
The path of this very important Eclipse is seen in the following:
I added the chart of Iran to this post. The center circle is the Chart for Iran when the Ayatollah Khomeini returned to Iran. The outer circle is the planetary position for May 20, 2017.
Note the square between the natal Pluto and transiting Pluto. Also note transiting Mars is trine natal Pluto and transiting Mars is quintile transiting Pluto.
There is going to be trouble in Iran in the next few months. July / August may be it.
Following is a chart (Sagittarius Rising) of the USA in the inner wheel and the current time in the outer wheel.

There is a forming square which will affect the affairs of the USA over the summer and fall months (mentioned above). This is the square between transiting Saturn and natal Neptune.
The traditional influences are illusion, delusion, confusion, lethargy and possibly depression. It is as if everything has taken on a dull sheen. If you were a writer you would call it the experience of the writer's block. Rather than force matters, take some time to contemplate your life in a gentle, reflective light.
From a Mundane Astrology perspective, it covers socialism, and left wing political ideas. It is associated with mobs, secret plots, fraud, swindling, bogus companies, loss and liquidation. This same aspect was near exact during the election period. There are more cycles building during July / August period. More on this in the next subscribers report.
Author

TradingDaze
Aisys Technologies Inc.
Gordon Lawson, aka TradingDaze, is a Canadian CPA, certified computer programmer and Astrologer. My traditional career spanned 25 years as a Financial Analyst at Suncor and Manager of Information Systems at BP Resources Canada. After this time Mr.


