SP500 A Dip?

SP500
For the SP500, cycle-wise I’m looking at March 27th as the Primary cycle trough. I’ve left the other possibilities on the chart. They were April 13th and the 25th week of the older cycle. April 13th appears to be a double bottom to the March 27th low.
This puts us entering the 5th week of a new Primary cycle. We should therefore be looking for a pull back into the first 6 week cycle trough. The other possibility would be a ½ Primary cycle but going with the 6 week cycle for now.
We had a descending triangle (green) on the chart. As often happens price crashed through the upper line of the triangle, in effect gaping twice. Those gap areas may act as resistance although I’m expecting a move down to the 6 week trough.
It should be noted Primary cycles (18 weeks) most often start with a nominal 6 week sub-cycle. The 2nd most common start is a 1/2 Primary or 9 week sub-cycles. The nominal range for the Primary cycle is 13 to 21 weeks. Currently the high of this cycle was on March 1st closing at 2396 in the SP500. This high was very late in the cycle. It is very right translated which by itself would be bullish.
The last 2 months have been unusual and very difficult to forecast. A turn on April 13th was just before the Sun conjunct Uranus and Venus turning direct from retrograde.
To summarize, I’m looking for a pullback in the short term to a 6 week cycle trough. I’m expecting volatility with both ups and downs but moving forward I’m looking for a low mid-year (June / July) but probably June after reviewing the Astrological aspects.
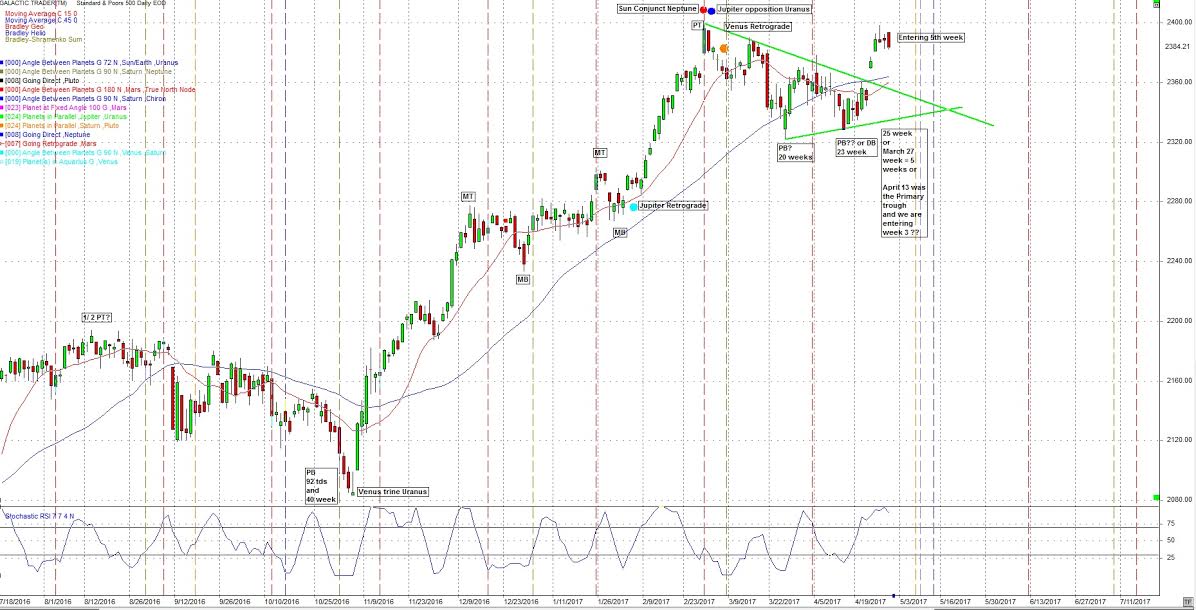
Note the 15 (red) and 45 day (blue) sma’s. Price dropped below the 15 and 45 day sma’s and has now risen above those averages.
This coming week has fewer significant Astros than what we have seen in March and April. Nevertheless, there are some new ones and the longer term aspects we have mentioned still apply and confusing Mercury continues it’s retrograde motion until May 3rd.
April is filled with powerful Astrological aspects and events. Don’t discount the aspects of the larger planets. They can cover longer periods of time. For example, 2 weeks ago we had Saturn going retrograde. This can last for a number of weeks and is a period of review, taking stock, restriction, fear and correct recent mistakes. The Sun always trines Saturn approx. 11 cd’s, (calendar days) after Saturn turns retrograde. This was April 17th.
This is a month of retrogrades. The following planets turn retrograde or direct this month; Saturn retrograde, Mercury retrograde, Venus direct and Pluto retrograde. See last week’s blog.
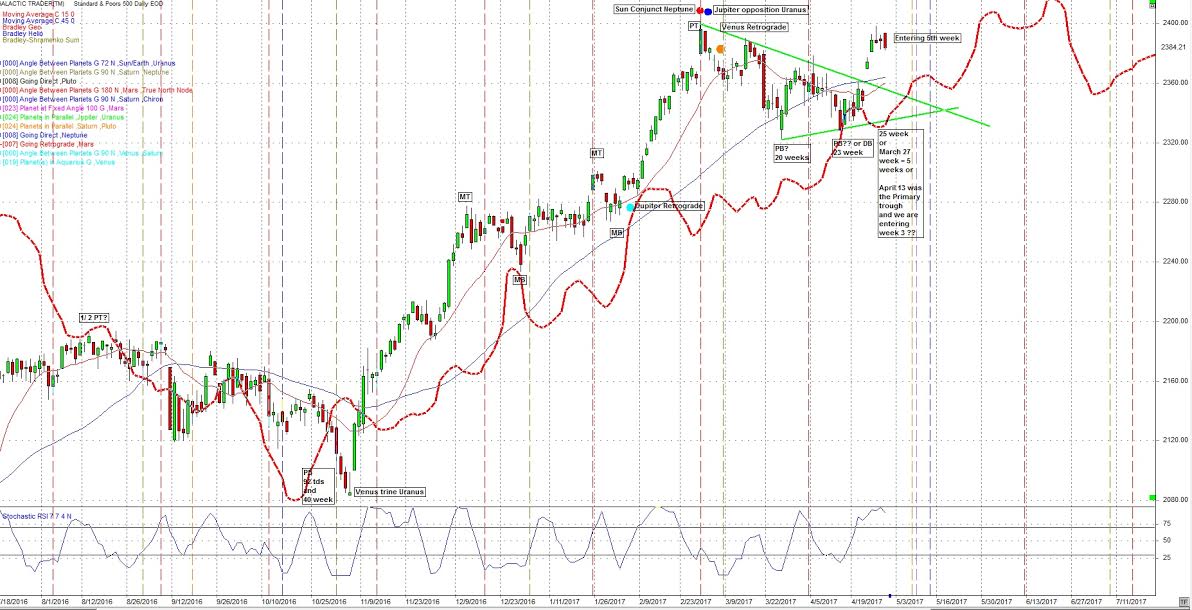
The following chart of the SP500 includes the original Bradley indicator (red line). There are two possible change in trend dates, which maybe the 6 week lows on May 8th and May 12th.
The first week in May has some unusual aspects in Cycle Charts. This will be covered in the subscriber’s letter. Cycle Charts are drawn up for a planet when it crosses 0 degrees of declination from South to North. Venus, the ruler money is prominent. This happening while the USA is considering a change in the corporate tax rate to 15%
This should be a volatile period.
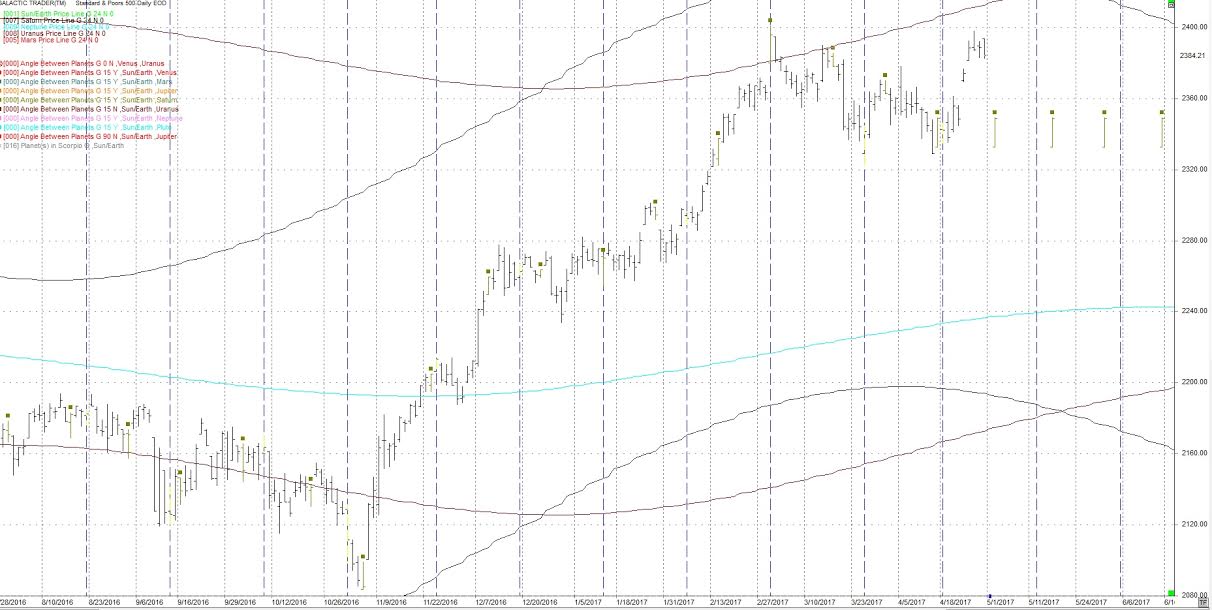
I continue to watch the 24th harmonic cycle (360 / 24) cycles for short term turns. The brown squares are Sun / Saturn 15 degrees on the following daily chart.
The last hit was on April 17.
The next hits are May 2nd then May 17th. Either could eb the 6 week low.
I have added 3 price lines to this chart.
Saturn - black
Uranus - purple
Neptune - light blue
These price lines can act as support / resistance. Also on this chart are blue vertical line which is the 24 cd (calendar day) cycle. It has been at highs and lows.
The date of March 1st is the same date as the 24 Harmonic. We went down.
Looking forward I'm expecting difficult markets through the May timeframe.
Author

TradingDaze
Aisys Technologies Inc.
Gordon Lawson, aka TradingDaze, is a Canadian CPA, certified computer programmer and Astrologer. My traditional career spanned 25 years as a Financial Analyst at Suncor and Manager of Information Systems at BP Resources Canada. After this time Mr.


