SP500
SP500
For the SP500, cycle-wise I’m looking at March 27th as 1 Primary cycle trough and April 13th as a double bottom.
It appears the recent Primary cycle low was August 21st, the day of the Total Solar Eclipse. The energy of the eclipse of this eclipse is still being felt. First from Harvey, now Irma. We also had an 8.1 earthquake in Mexico on the night of September 7th. That evening Mercury, now moving direct, passed over the point of the Total Solar Eclipse.
Assuming the eclipse energy is still strong Venus will pass over the point of the Total Solar Eclipse on September 18th. I’ll check for other objects that may pass over this powerful point.
In the case of Venus it will also be waning trineSaturn on Sept 12 and waxing trine Uranus on Sept 18th. We could be looking at a turn in this time frame.
As mentioned before this eclipse was also on the fixed star of Regulus. You can find all the fixed stars in longitude on the blog under “Fixed Stars”.
This should put us entering the 4th week of the Primary cycle. Please note this is very shallow for a Primary Cycle trough that occurred on Aug 21. There is still an outside chance that March 27th was the last Primary cycle trough but this is quickly fading. The 15 daysma did move below the 45 day sma but was not very deep.
There may be other cycles about to move down into their cycle troughs, notably the 50 week cycle which often occurs close to the Saturn Direct signature. Saturn turned direct on August 25th. Other longer-term cycles may have the trough lower than normal.
If you review what we were looking for from the Total Solar Eclipse I had mentioned violent weather as one item. Harvey was it, and now Irma. I had also mentioned earthquakes and there was an 8.1 trembler in Mexico.
With the other cycles and Astrological events this may mark the end of the bull market that started in the lows of 2009. This could take some time.
As suspected Trump has been very affected by the Total Solar Eclipse. North Korea, after the Total Solar Eclipse, launched another missile.
Remember, like an Aspect between two planets we should give the eclipse an orb of influence. The rules are in the Subscribers report.
I had also mentioned that it may affect Israel and possibly other countries and leaders that I have not found yet. Israel has been bombing Syria this week.
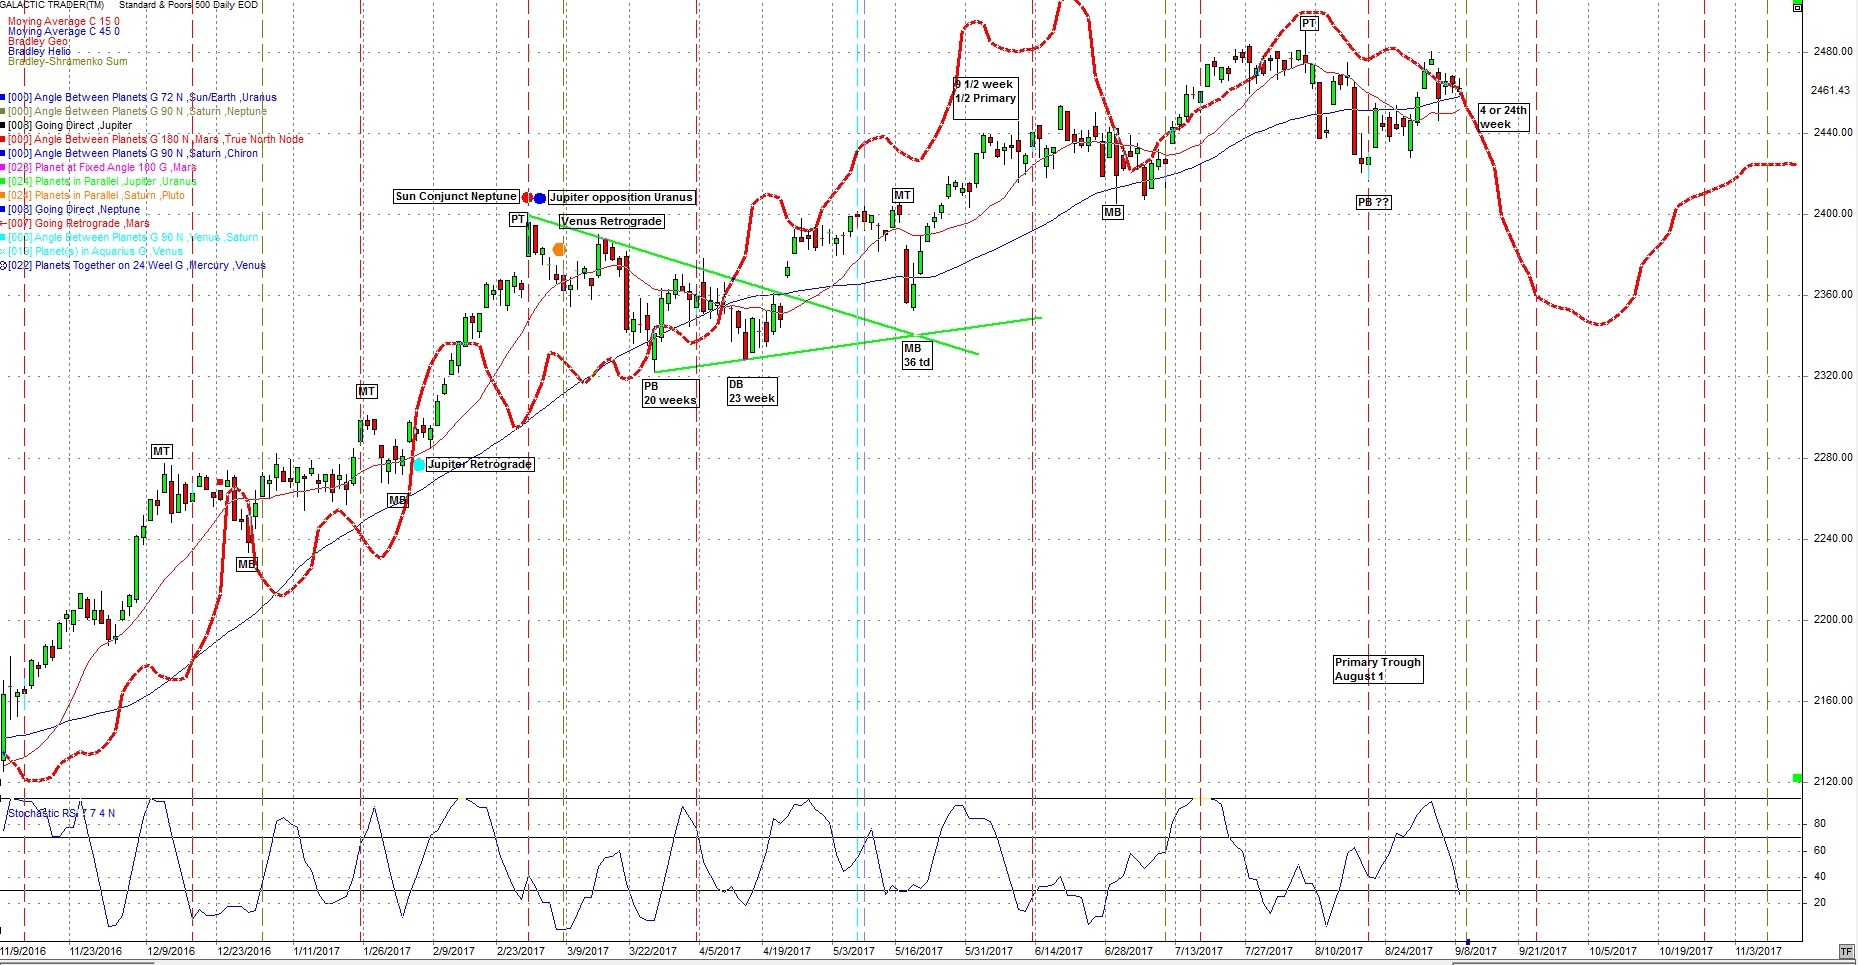
The following daily chart of the SP500 shows the Geocentric Bradley indicator (thick red line). It indicated a change in trend on September 8. Watch this closely. We may be going down into early October, possibly October 6th the next Bradley turn date.
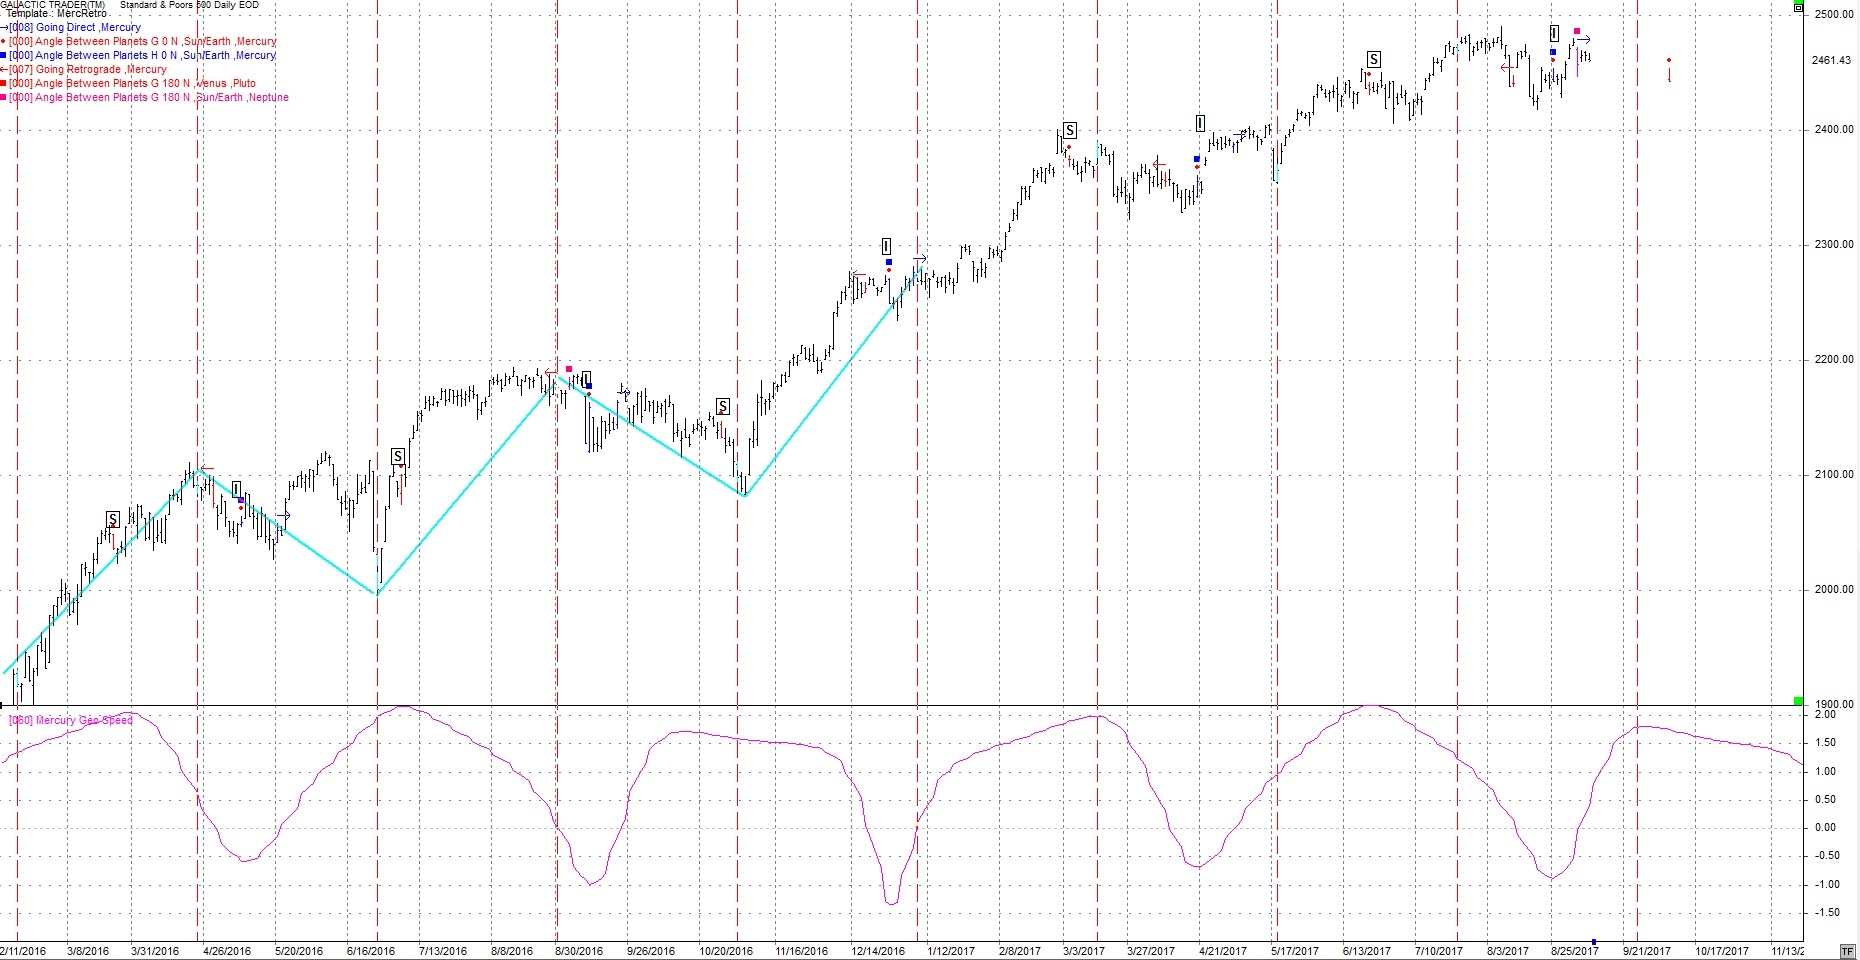
The following daily chart of the SP500 shows the key Mercury retrograde events. The red arrow pointed left is the Retrograde date. The small red circle and blue square is the Inferior conjunction of Mercury and the Sun. The blue arrow is Mercury turning Direct on September 5th. Note the price movement of these key dates on the chart. I expect volatility through September 5th and probably beyond.
Uranus will be semi square Neptune from mid-July through October. The last exact date was August 11th. This will be a longer period of delusion / deception. It may be more like a fog that has descended that is confusing. For the markets people won’t know what the direction will be. Among other things Neptune stands for water. Look for rain storms through October.
From “The Book of Rules” aka “Rule for Planetary-Picture’s.
Uranus/Neptune
Suddenly incapacitated, unconsciousness, Checkmated, Crisis, Revolution, Dead Persons.
In the subscribers report we go more detail on the Total Solar eclipse and it’s potential effect on President Donald Trump. This covers the Saros cycle which traces this cycle back to the period of time John F Kennedy was assassinated, the Cold War and Cuba / US conflict.
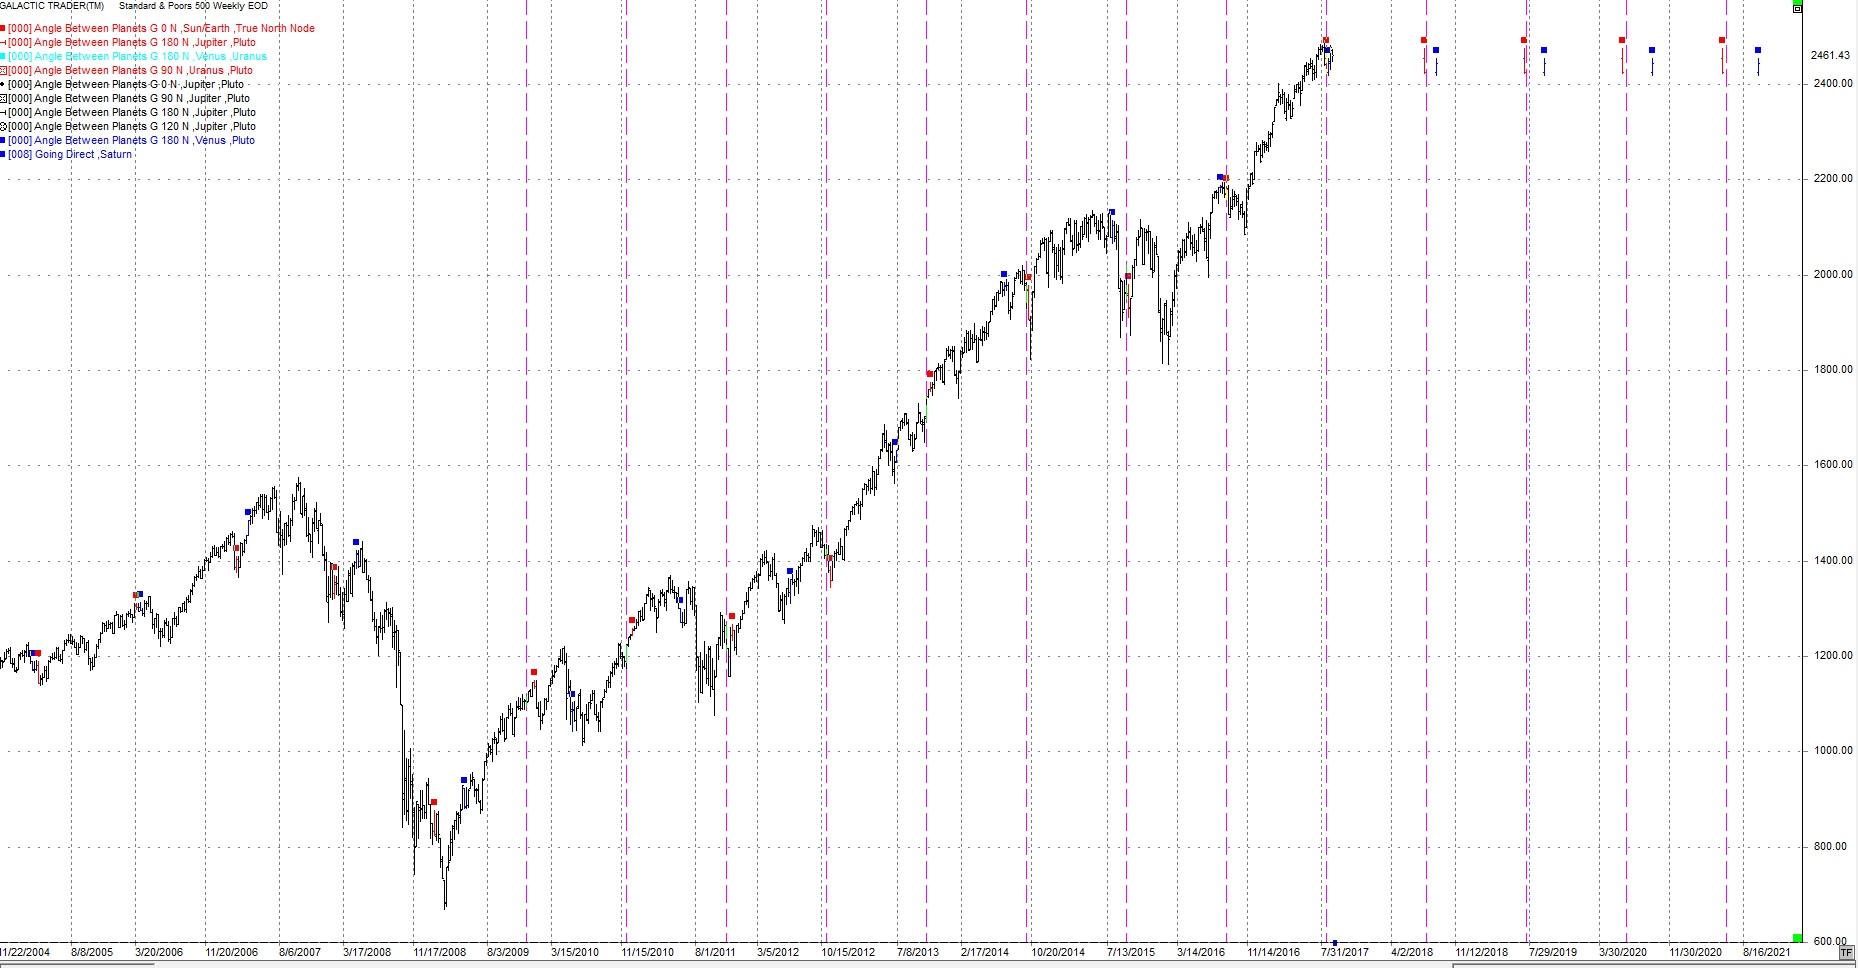
Another cycle that is coming up is the 50 week cycle. These are shown as the pink vertical lines on the following chart. The red squares show the Sun conjunct the North Node. There is a Sun North Node conjunction on August 16th. As I would expect a substantial decline, this time may be unusual in that the markets have been distorted by Central Bank money. The red squares are the Earth conjunct the North Node. Saturn Direct also has a history of occurring near a 50 week cycle. See the blue squares for Saturn direct.
We still have:
- the 45 year Saturn / Uranus trine Next due November 11
-The 12 year Jupiter / Pluto Square Last August 4 (Ill be taking this one out)
-The 14 year Jupiter / Uranus opposition Next due Sept. 28
These longer-term aspects need a broad orb and should be +- a few weeks at least. They have been described in the subscriber report. Note the Jupiter / Pluto waning square is often seen close to Primary cycle turns although there are not that many occurrences.
In addition to the above there is a potent transit between transiting Saturn square the USA natal Neptune. Hard aspects to the USA's Neptune and Mars often coincide with financial disruption. Saturn will square the USA Neptune and oppose it's natal Mars 3 times in 2017. January, July and October.
The effect of Saturn square Neptune is deflationary. With the buildup of credit in the economy the above aspects could bring on defaults, cash shortages putting stress on the credit markets.
From “The Book of Rules” aka “Rule for Planetary-Picture’s.
Saturn/Uranus
Quarrels, sudden separation,
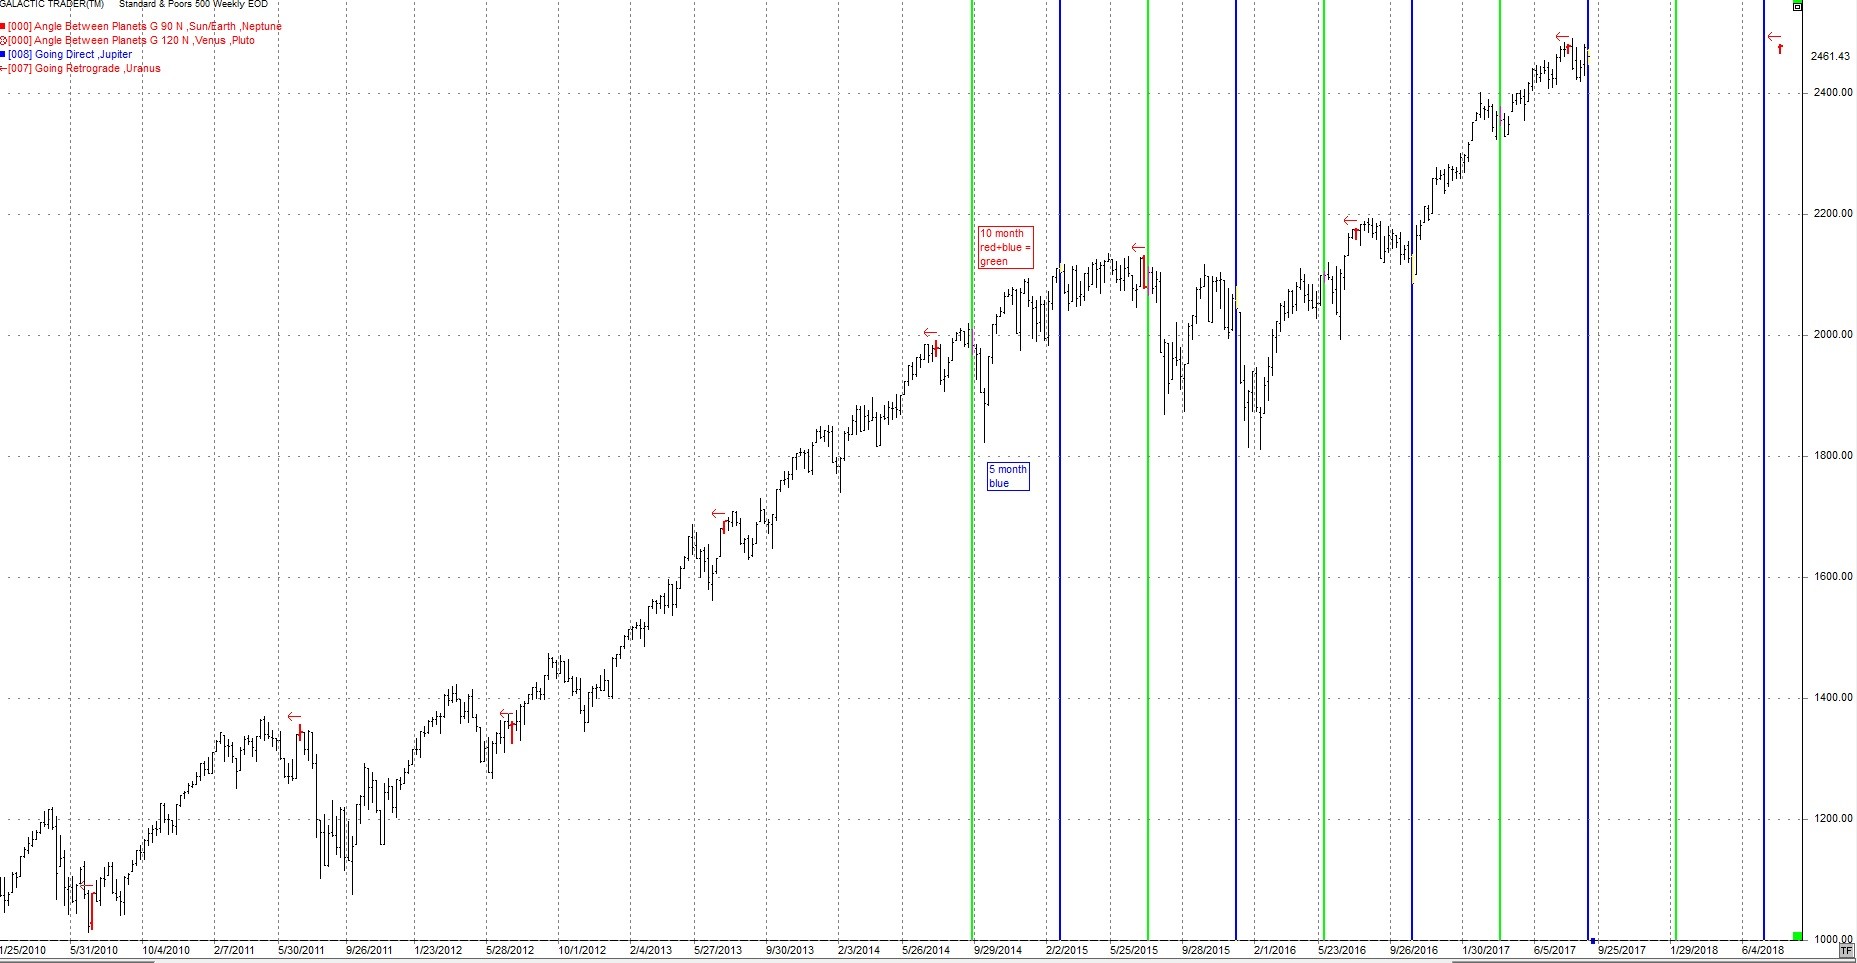
The following weekly chart of the SP500 shows the 5 month (blue) and 10 month (red). The next 5 month cycle is September 4. The 5-month cycle often is at a low or the start of a slide down
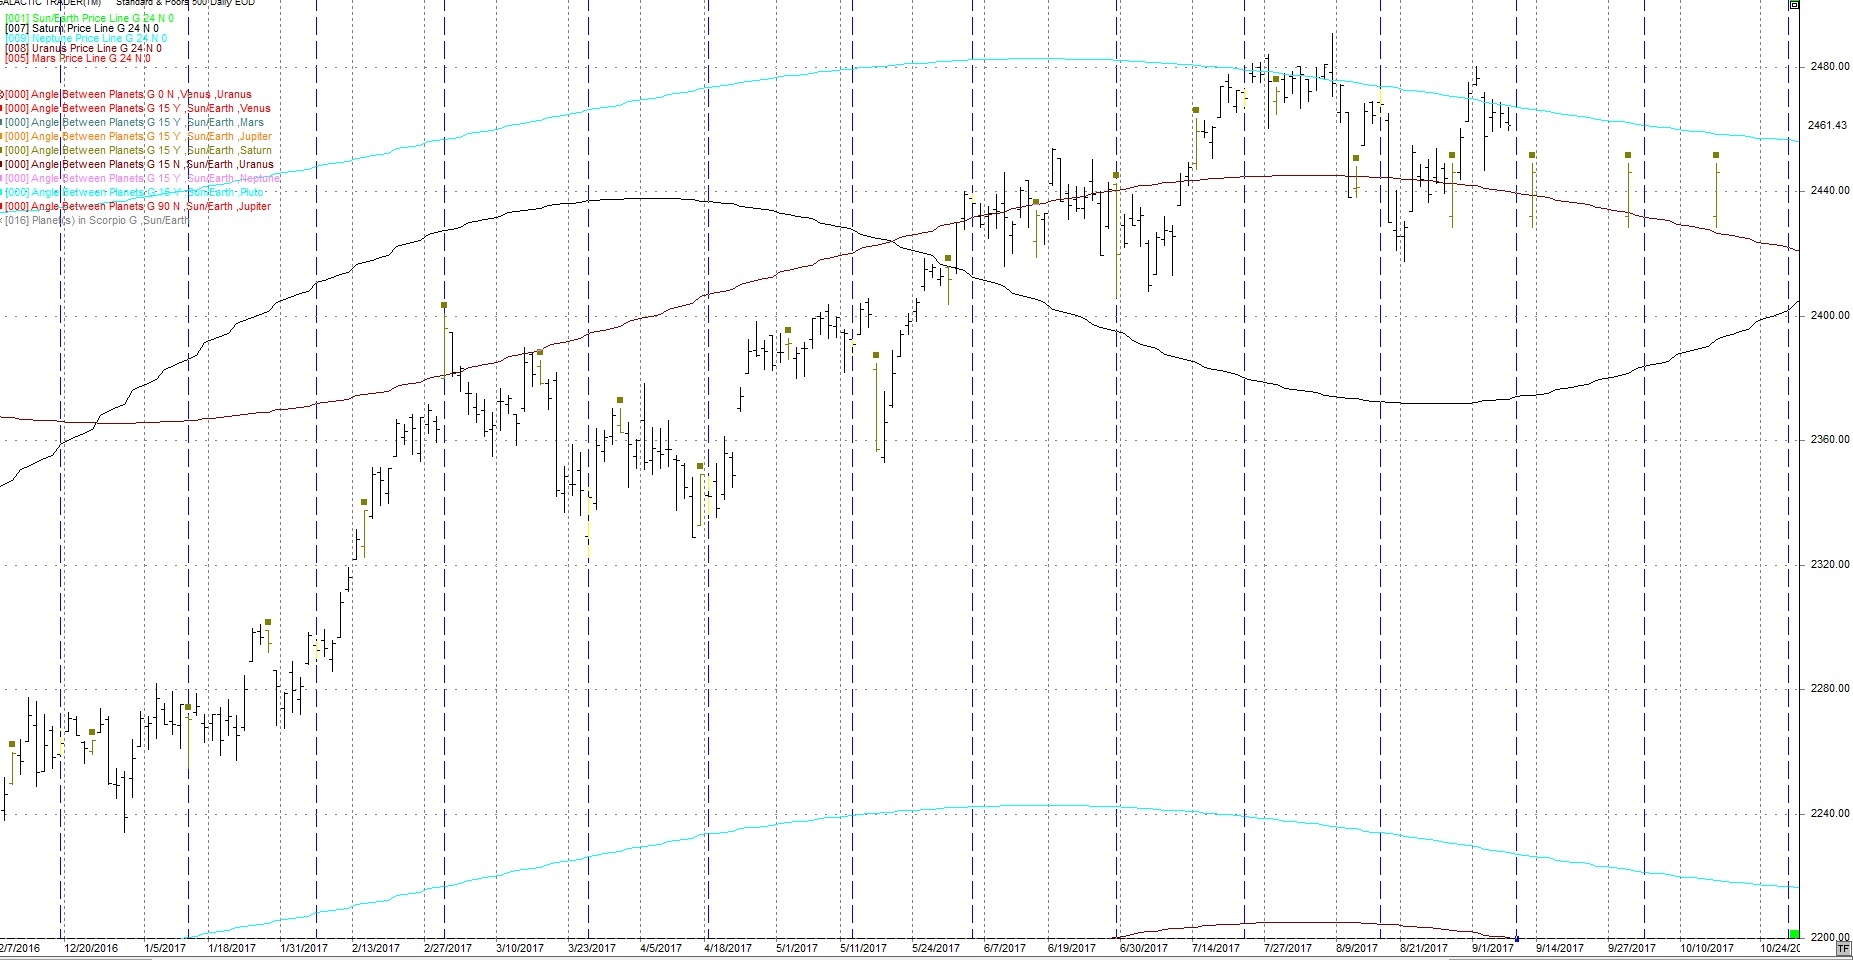
I continue to watch the 24th harmonic cycle (360 / 24) cycles for short term turns. The brown squares are Sun / Saturn 24 degrees on the following daily chart. The blue vertical lines are 24 cd’s (calendar days).
June 29th, July14th and Aug 29 were big range days.
The next hits are Sept 13 then Sept 13th.
I have added 3 price lines to this chart.
Saturn - black
Uranus - purple
Neptune - light blue
These price lines can act as support / resistance. It has been at highs and lows. Note also when they cross often gets a reaction in price on a short-term basis. Also note, near the top of the chart is a light blue line. This is the Neptune PriceLine. Note how it has been strong resistance to price but just broke through. I’ll be surprised if price stays above the Neptune priceline.
Gold
Gold put in an impressive rally over the last few weeks.
July 7th appears to be the Primary cycle low and we are 9 weeks along. Remember the 6 week and 9 ½ week are typical cycle lengths to start a new Primary cycle in Gold. I am obviously looking for the 9 ½ week cycle at this point.
Note on the first Gold chart below, the red horizontal lines are the retracement from the move up from December 2015 to Aug 4, 2016. Gold had gone sideways at the 23.6% retracement. Gold appears to be breaking up and move up to the 9 ½ week cycle.
I’m looking for Gold to put in a high and then move down quite possibly next week. Gold is due for a pullback then quite possibly up from there after a the pullback.
The following chart shows seasonal tendencies for Gold. The 2nd half of the year, on average, is up.
I was looking at precious metals being the potential trade of the year but there will be pullbacks. This may be delayed.
The following chart shows a 27 cd (calendar day) cycle (blue vertical lines). The last one being on August 9 and the next September 5th.
The red lines headed up are the Mars pricelines. Watch the Mars Price Line to see if it acts as support / resistance. Note price closed below the Mars price line on Sept 8th.
Crude
We are looking at June 21st as being the trough of the Primary cycle. The move out of that date looks like the start of a Primary cycle.
The horizontal blue lines are the average longitude of the planets Jupiter, Saturn, Uranus, Neptune and Pluto. Note how price stopped on August 1 and August 31, right on the average longitude.
The horizontal red lines are the Fibonacci retracement from Nov 14, 2016 to Feb 21, 2017.
Crude, gasoline and other byproducts are going to be affected by the results from Harvey and Irma. Gasoline and other products have prices up and chemical plants have been affected.
Any move close to 46.00 should be a buy.
There were a number of aspects involving Jupiter and Neptune, which resulted in a move up from June 21st. Jupiter and Neptune are the co-rulers of Crude and NatGas.Watch the period around September 28 where Jupiter aspects both Neptune and Uranus. Venus opposes Neptune in the same time frame.
One other chart I’m watching is the 16 and 24 week cycles on a crude chart. The 16 week is the red vertical lines and the 24 week is the blue vertical lines. When they hit together they form the green line. Note that it is often a low, a big range day or reversal. Next up is September 11th.I’ve mentioned before the 11th of each month can be a move in crude or crude equities.
Following is a chart (Sagittarius Rising) of the USA in the inner wheel and the current time in the outer wheel.
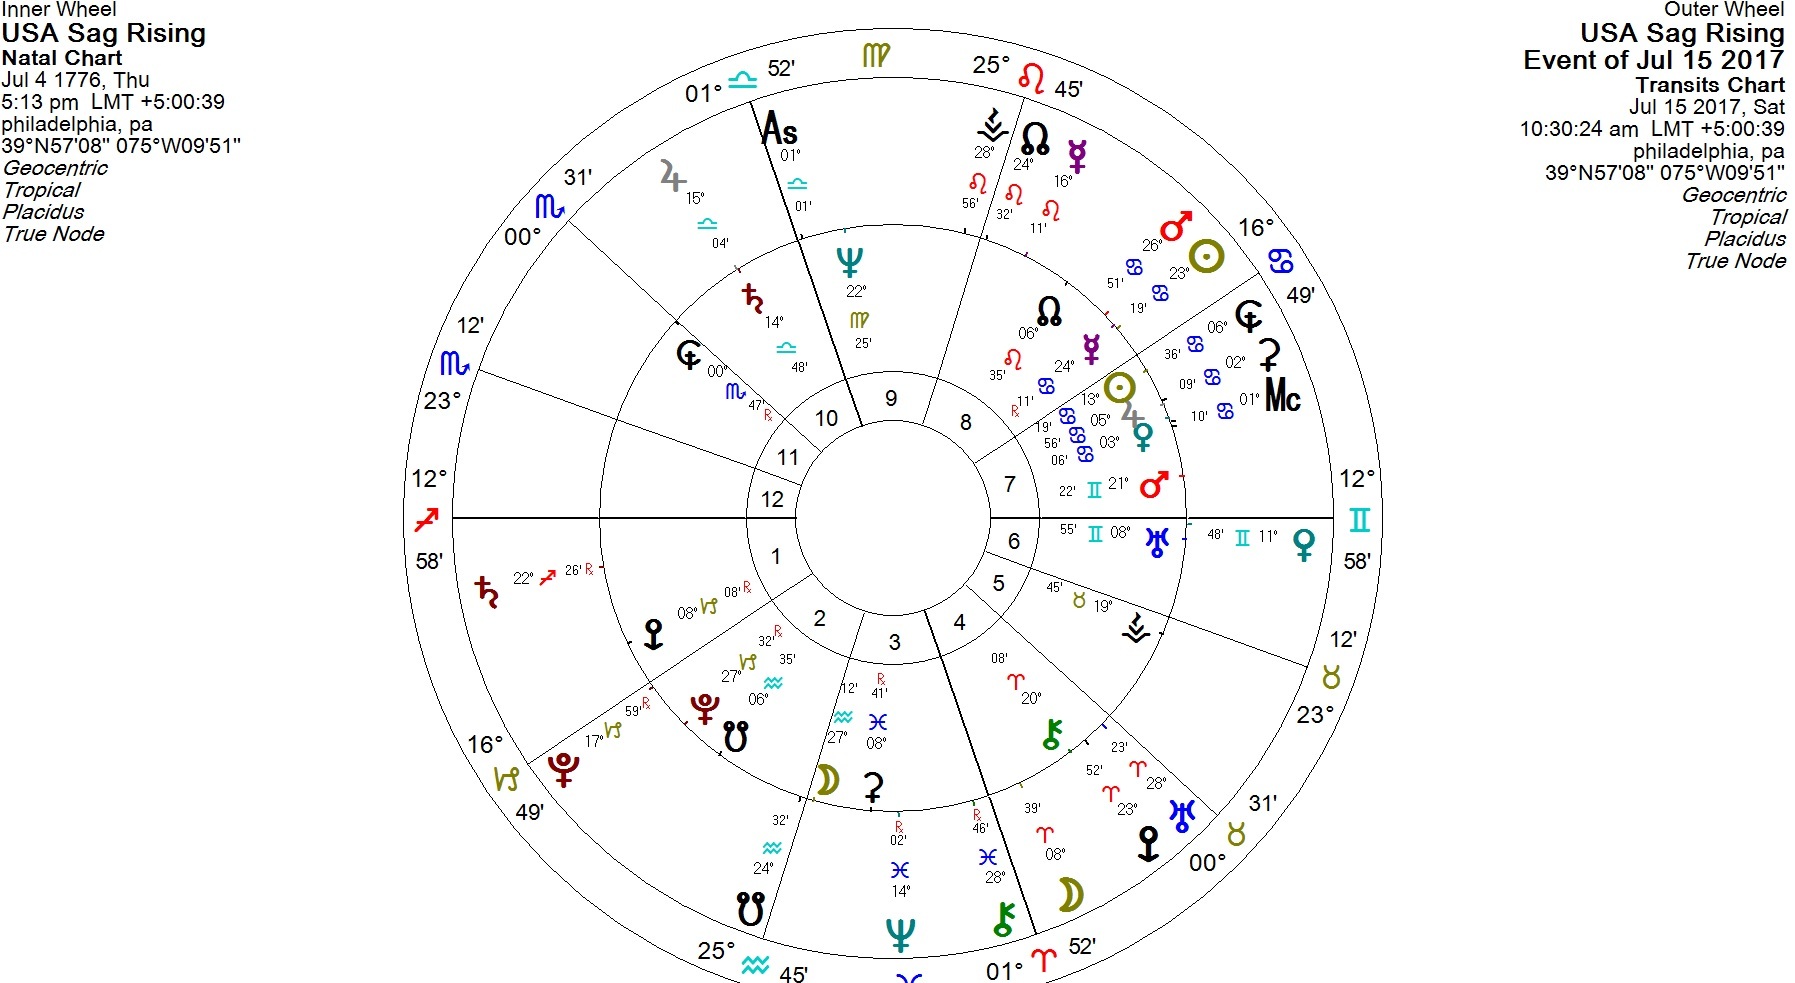
There is a forming square which will affect the affairs of the USA over the fall months. This is the square between transiting Saturn and natal Neptune. Note Saturn is retrograde until August 25th, then starts moving forward.
The traditional influences are illusion, delusion, confusion, lethargy and possibly depression. It is as if everything has taken on a dull sheen. If you were a writer you would call it the experience of the writer's block. Rather than force matters, take some time to contemplate your life in a gentle, reflective light.
From a Mundane Astrology perspective, it covers socialism, and left wing political ideas. It is associated with mobs, secret plots, fraud, swindling, bogus companies, loss and liquidation. This same aspect was near exact during the election period.
Author

TradingDaze
Aisys Technologies Inc.
Gordon Lawson, aka TradingDaze, is a Canadian CPA, certified computer programmer and Astrologer. My traditional career spanned 25 years as a Financial Analyst at Suncor and Manager of Information Systems at BP Resources Canada. After this time Mr.


