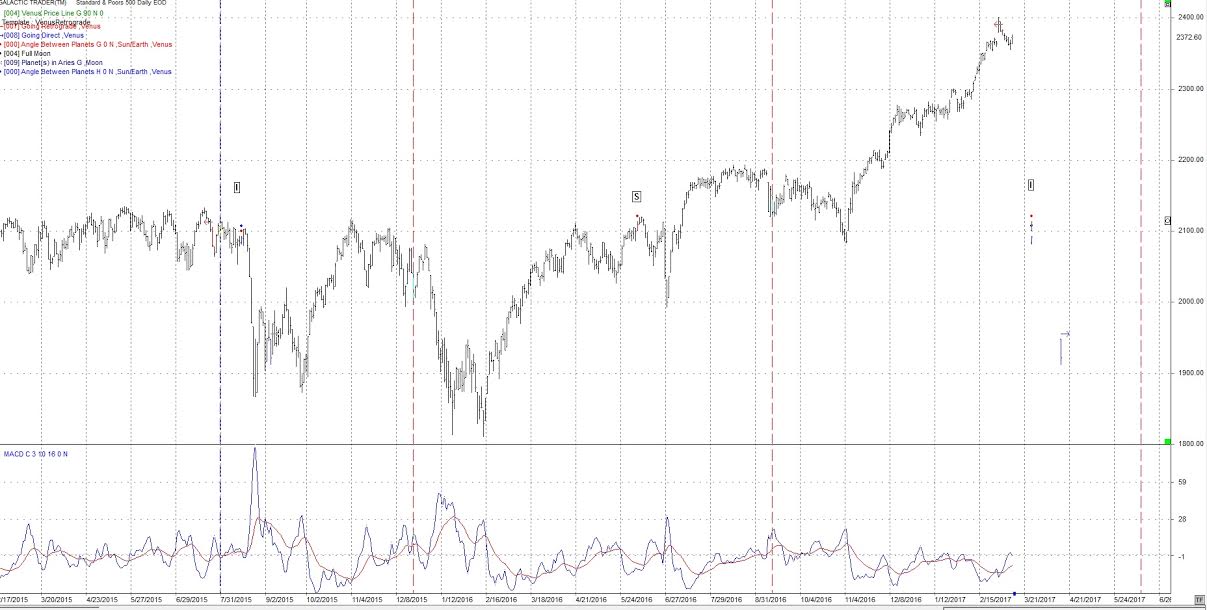
SP500

SP500
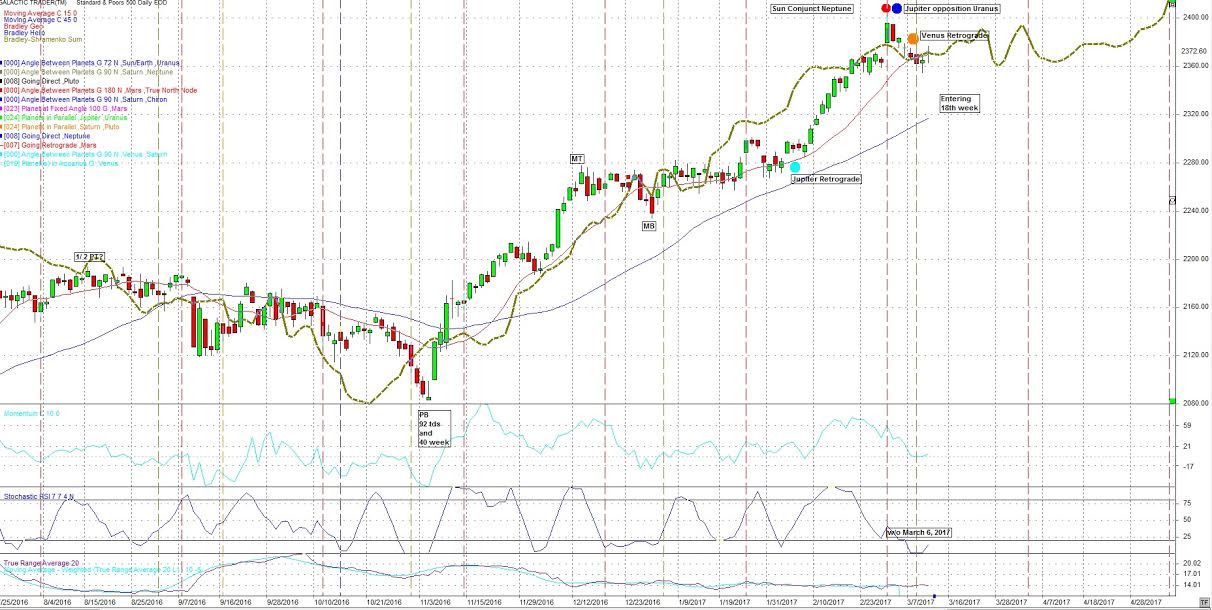
For the SP500, cycle-wise November 4th was the Primary cycle trough. 1 which puts us entering the 18th week of a nominal 18 week cycle. November 4th was the 40 week cycle trough as well.
The 1st Half 2017 Forecast dates, given to subscribers, are estimated from Astrological events only. As time unfolds we have the benefit of market cycles and possibly additional Astrological events. Nevertheless the original dates have fared very well. See the blog post of December 11, 2016, showing the original forecast dates for the SP500. These are the original 6 month dates with no adjustments for the last 3, 6 month periods.
It should be noted Primary cycles (18 weeks) most often start with a nominal 6 week sub-cycle. The 2nd most common start is a 1/2 Primary or 9 week sub-cycles.
I'm looking for closes below 20,780 for the DJIA and lower than 2357 for the SP500. If we can get below those levels then this will identify the last few weeks as the end of a topping process.
We are in the difficult period of time mentioned for some time. The exact date for a number of the heavy transits have either passed or they are in front of us. Note there are a number of longer term transits in effect which are reserved for subscribers.
We have had a number of powerful Astros which I will put on the following chart (see colored circles). There are others but these should have been the most potent.
Light blue - Jupiter retrograde Feb 6
The market increased it's move up.
Red - Sun conjunct Neptune March 1
Expected a change in trend and got it. I had expected more of a move.
Blue - Jupiter opposition Uranus March 2
Expected a change in trend and got it. I had expected more of a move.
Orange -Venus retrograde March 6
We are still under the effect of the Venus retrograde.
To summarize, there was a tremendous move up from November 4, 2016. It went sideways starting in early December then up again near the Jupiter retrograde on February 6th. From here the markets hit the Sun conjunct Neptune transit, the Jupiter opposition Uranus and Venus retrograde. These three hitting so close together should have given us a larger move down, change in trend. We went up today, March 10, after the employment report, but expect the market to move lower as the 18 week trough should be in front of us.
I had mentioned the middle two weeks of March 2017 have less powerful transits. There is a Sun squared Saturn on March 17th and on March 25 the Venus inferior conjunction with the Sun. The inferior conjunction of the Sun and Venus is in the middle of the Venus retrograde period and can be just as strong as the Venus retrograde and Direct dates.
Although we many not have many Astros next week we do have two potential events over March 15, 16th which could effect the markets strongly. These are, in the U.S.A. the probable 1st rate increase by the FED and secondly the Debt Ceiling Holiday created by Obama and Boehner is over. The second may be the most important.
The energies of the February 26th Solar eclipse should be climaxing during this weekends Full Moon on Sunday.
Also coming up is the Sun's entry into Aries on March 20th. This is the beginning of the Astrological New Year. This chart is a representation of what to expect in the coming year. You can create this chart for the countries capitol or in my example for New York , the financial centre of the USA and the world, for now.
The chart follows and shows the Sun entering Aries. This chart has Neptune on the Ascendant. This may represent the effect of big oil on the US. It could also represent uncertainty, delusion and hidden activities. This sounds like what is going on right now with the CIA, Wiki leaks etc. Neptune is strong. It is in Pisces the sign that it rules. I've mentioned a number of times of a water event in the US. Pisces is a water sign.
This chart also has the Moon conjunct Saturn in the 10th house. The Moon represents a nations people and Saturn discipline and restriction. The people of the USA should be under the influence of Saturn. This can also be depressing.
The Moon and Saturn are on the Galactic center during the Sun's move to 0 degrees Aries. In addition the Moon and Saturn are on the fixed star Etamin. According to tradition, the Saturnian predominance will give a liking for solitude. Good mental concentration. Dishonor and downfall and loss of prestige.
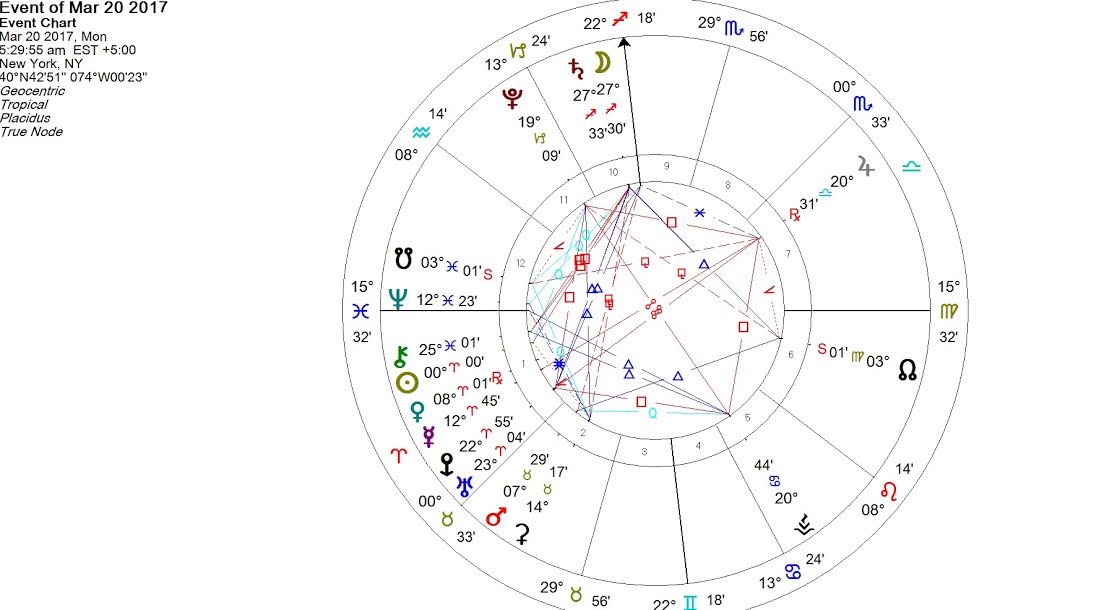
Watch for potential geophysical events, violent weather or increased conflict. Mars is the planet of war, conflict and aggression. From other sources there may be an event or issue with water in the USA.
Looking to the next Presidential election, 2020 Jupiter and Saturn will be conjunct near the cusp of Aquarius an Air sign. More on this and the Mutation conjunction of Jupiter and Saturn in the March subscribers report. The Jupiter / Saturn conjunction is a 20 year aspect and changes element approx. every 180 years.
The next estimated Primary cycle ( aka nominal 18 week cycle) low had been estimated to be March 6th +- 3 weeks with a range of February 13th, 2017 to March 19, 2017. It could also be the week of March 19, 2017 +- 3 weeks. March 6th, we can now see is too early but the week of March 19 is still possible. Early April is another possibility with 4 strong Astros which have a history of a change in trend.
The March 6, 2017 forecast was first mentioned in our blog post of November 14, 2016.
On March 7th +- 3 weeks, Saturn conjuncts the Galactic Center. The multi week period could define a move down. This may be very important. Bear in mind we are in an 8 year bull market. A move down could start at any time, the above are the most probable from an Astrological perspective.
As mentioned in previous weeks both Israel and Egypt (mid-East) may come to the fore this year as regards to conflict and aggression. Iran and Turkey may be included as well. This may be seen before the end of April. This is connected to the on-going Saturn / Uranus trine, a 45 year aspect which is exact again on May 19th.
Mars is active and can result in war or conflict. The US should stay out of any conflicts as they should concentrate on growing health and legal problems at home. If the US does get involved it could result in many casualties.
The second pass of the 14 year aspect, Jupiter opposing Uranus occurred on March 2nd. At times this opposition will be a T-square with Pluto at the Apex. The French Astrologer, Barbault considers this transit to be predominantly a capitalist oriented cycle. This transit could bring a spirit of collective optimism. This may be particularly opportune at this time in the USA. Don't look for an immediate event. Look for a swing to the right politically. Revolutionary activity. This aspect has a history of market turns
There is a Venus cycle which could be important. That is every 8 years or 5 Venus retro occurrences, Venus returns to approximately the same spot in the Zodiac. Venus turns retrograde on March 4th 2017. 8 years ago or 5 Venus retro occurrences Venus turned retrograde on March 6, 2009. This was the day of the low in the major US indices. If, for some reason, we do not get a change in trend in late January / early February then the March or early April date would be a good candidate for a turn.
On the daily chart of the SP500 above. The brown line is an adjusted Bradley indicator. It's purpose is to find a change in trend. This is not straight forward to read and the details with video are in section 9 of the subscribers report. What appears to be the next Bradley turn is March 1st +- 3 tds.. Also Price is above both the 15 and 45 day sma's. and the 15 day sma is above the 45 day. This would still be a good time frame for the start of a slide down.
Harmonics
I continue to watch the 24th harmonic cycle (360 / 24) cycles. The brown squares are Sun / Saturn 15 degrees on the following daily chart.
The last hit was on March 1st. This may have started the change in trend.
The next hits are March 17, 2017 then March 31.
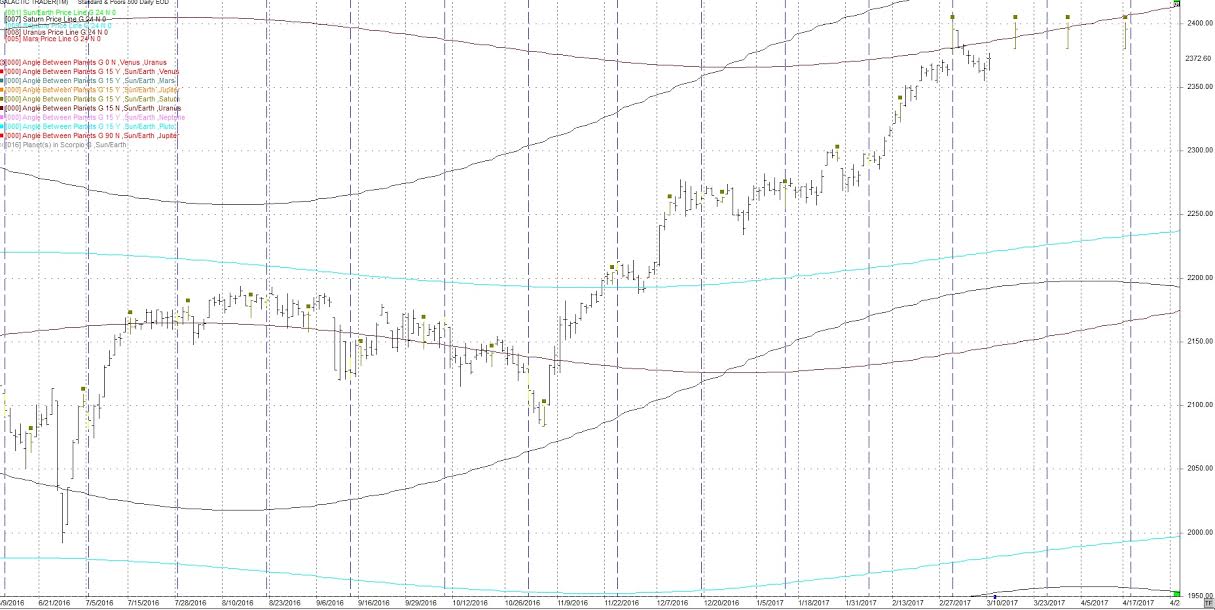
I have added 3 price lines to this chart.
Saturn - black
Uranus - purple
Neptune - light blue
These price lines can act as support / resistance. Also on this chart are blue vertical line which is the 24 cd (calendar day) cycle. It has been at highs and lows.
The date of March 1st is the same date as the 24 Harmonic. We went down.
Looking forward I'm expecting difficult markets in the late March through April timeframe.
There have been a number of earthquakes over the last couple of weeks. I'm expecting more. I look for earthquakes 6.5 and over.
Author

TradingDaze
Aisys Technologies Inc.
Gordon Lawson, aka TradingDaze, is a Canadian CPA, certified computer programmer and Astrologer. My traditional career spanned 25 years as a Financial Analyst at Suncor and Manager of Information Systems at BP Resources Canada. After this time Mr.


