SP500

The next 1/2 year Forecast Dates will be available for purchase in mid-December.
(January, 1 2017 - June 30, 2017
Subscribers receive 6 months forecast no matter when they sign up.
SP500
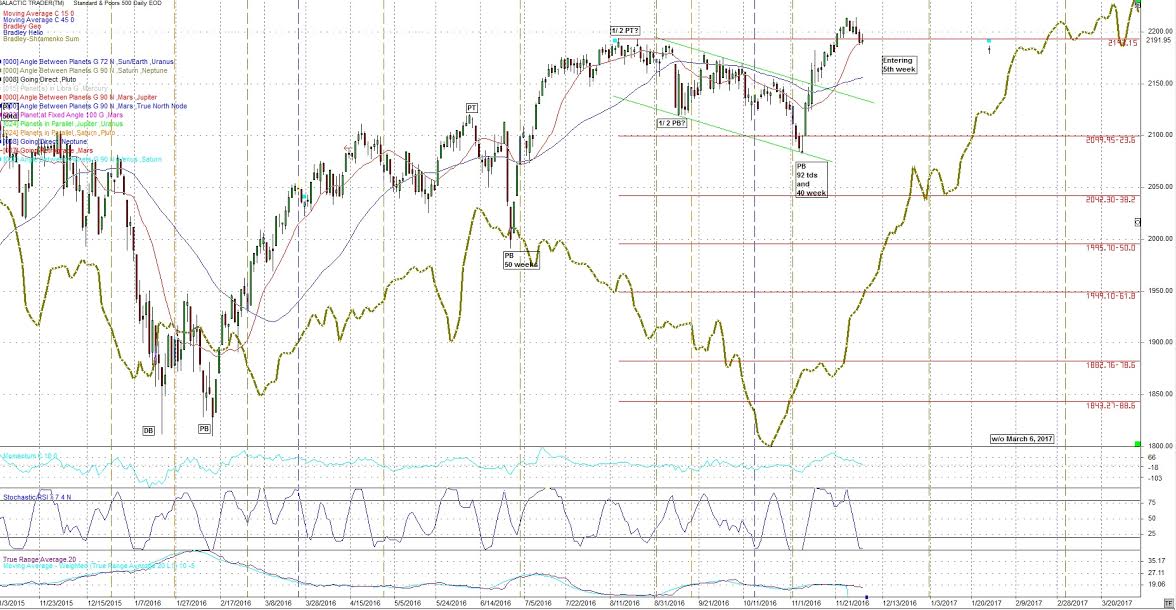
For the SP500, cycle-wise November 4th looks like the Primary cycle trough. 1 which puts us entering the 5th week of a new nominal 18 week cycle. This was the 40 week cycle trough as well.
The next estimated Primary cycle ( aka nominal 18 week cycle) low is estimated to be March 6th +- 3 weeks with a range of February 13th, 2017 to March 19, 2017. It could also be the week of March 19, 2017 +- 3 weeks. As we get closer I will use the upcoming Astros to try and get a more exact reading on when the Primary cycle trough will occur.
Last month had a number of Neptune transits. December has a number of Mars and Uranus transits.
On Monday December 5th the Sun will conjunct the heliocentric Nodes of Uranus which often results in a change in trend or big range day.
On December 13, 2016 there is a perigee Full Moon or Supermoon. Watch the period around December 13 +- 3 cd's (calendar days).
This could be a period of strong earthquake events or other geophysical activity. Also look for strong tides and possibly violent weather.
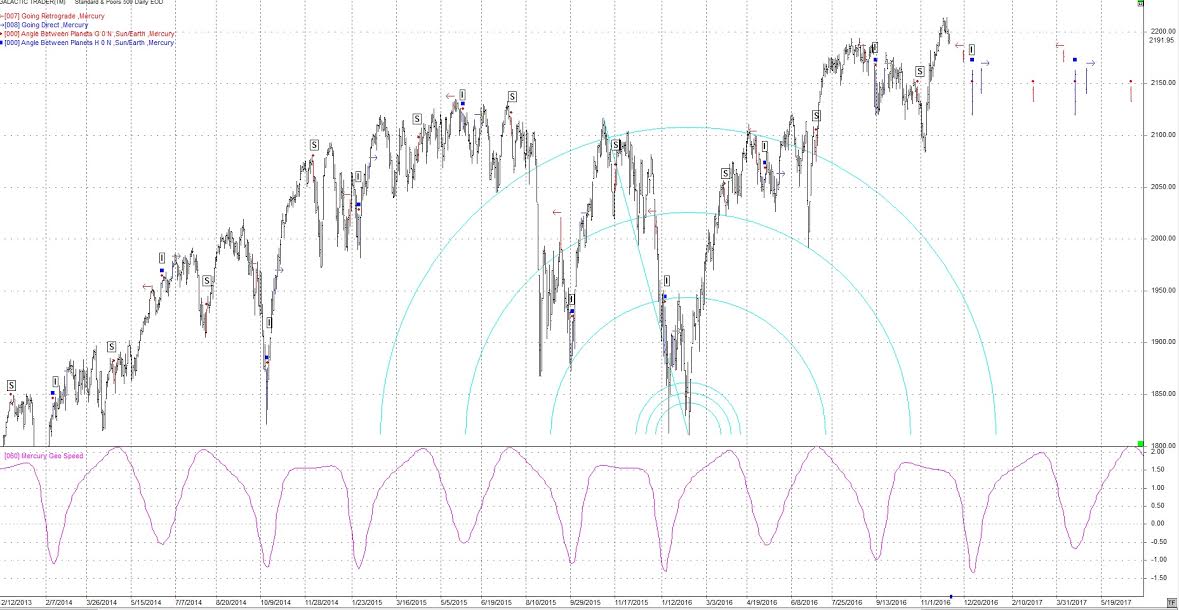
December 19 starts the Mercury Retrograde period. Covered many times, Mercury is known as the trickster and the retrograde period is not a good time to make decisions, or sign contracts or agreements. It's about confusion and mis-directed energy. Go ahead and plan. Mercury has it's most effect on people who know nothing about it. This Mercury retrograde will start when Mercury is almost exactly in conjunction with Pluto, suggesting a major agreement of some kind. Following is a daily chart of the SP500 with the Mercury retrograde (red arrow pointed left) and Mercury direct (blue arrow pointed right). This chart also shows the Superior and Inferior conjunctions.
December 26 when the US markets are closed for Christmas there is a 14 year aspect, Jupiter opposing Uranus. This is the first of a 3-pass in 2017. At times this opposition will be a T-square with Pluto at the Apex. The French Astrologer, Barbault considers this transit to be predominantly a capitalist oriented cycle. This transit should bring a spirit of individual and collective optimism. Look for progress as this aspect encourages and a perception of deeper potentialities, poses questions and opens up opportunities. This may be particularly opportune at this time with "The Donald" looking to improve the capitalist system which is the USA. Don't look for an immediate event. This is a 14 year cycle. Longer term transits, like this, need time to germinate. Nevertheless we can expect exciting, new events as the energy of this transit becomes assimilated.
In addition to this transit Mars will make a number of transits over the holiday period. This could be pointing to a violent period with possibly increased terrorist activity.
Following is a daily chart of the SP500. The brown line is an adjusted Bradley indicator. It's purpose is to find a change in trend. This is not straight forward to read and the details with video are in section 9 of the subscribers report. Price is now above both the 15 and 45 day sma's. and the 15 day sma is above the 45 day. They both turned up. A usual setup leading out of a Primary cycle low. Since this is the 5th week we should be aware we often get a nominal 6 week cycle to start a new Primary cycle and we appear to be turning.
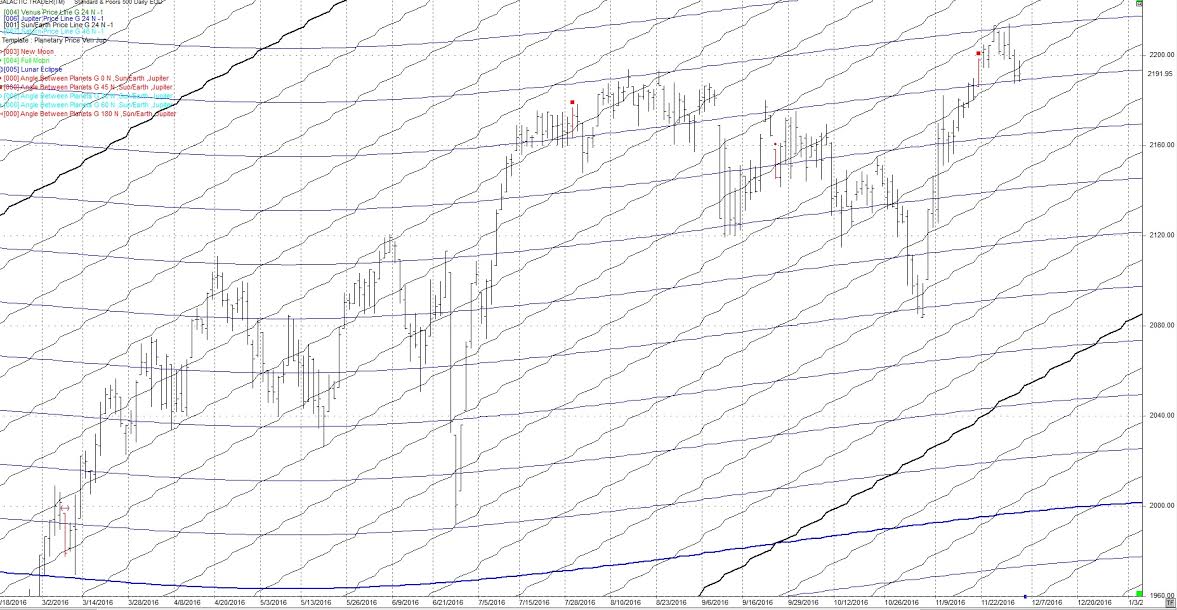
As far as aspects go, the Sun and Jupiter have an affinity for the SP500. The following daily chart of the SP500 shows the Jupiter (blue) price line and the Sun (black) price line. The price line is the longitude of the planets converted to price. On the following chart note the price tends to either reverse or make a sharp move where the Sun price line and Jupiter price line cross. Note the last price bar, 6 bars ago, on this chart is on one of these crossings. It stopped going up and has been drifting down. It may have found support on the blue Jupiter price line on the last 2 days.
Harmonics
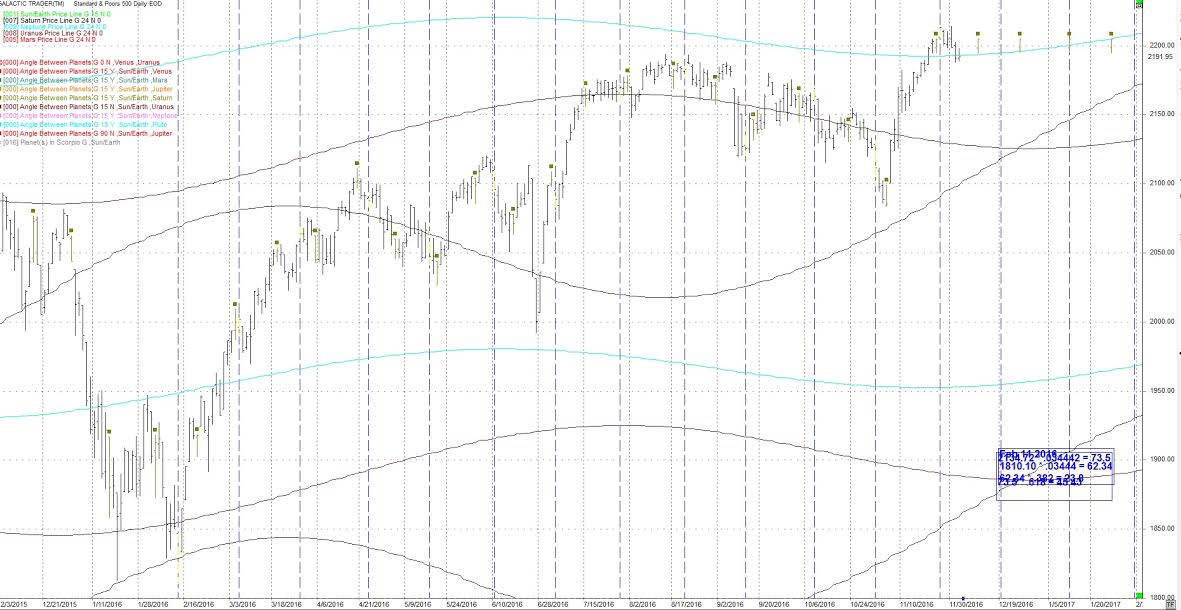
I continue to watch the 24th harmonic cycle (360 / 24) cycles. The brown squares are Sun / Saturn 15 degrees on the following daily chart. The second last hit was
November 4th, the day of the cycle troughs we have been following. The next hits are then Dec. 9th and December 26th. They are often at short changes in trend.
I have added 3 price lines to this chart.
Saturn - black
Uranus - purple
Neptune - light blue
These price lines can act as support/resistance. Notice we have just moved down to the Neptune price line (light blue). Watch for support or a bounce.
Also on this chart is a blue vertical line which is the 24 cd (calendar day) cycle. It has been at highs and lows. We just hit it today, November 25th.
There have been a number of earthquakes over 6.5 this week. I'm expecting more probably closer to December 13 or the end of December 2016.
“Paper money eventually returns to its intrinsic value. Zero.”
-- Voltaire
Author

TradingDaze
Aisys Technologies Inc.
Gordon Lawson, aka TradingDaze, is a Canadian CPA, certified computer programmer and Astrologer. My traditional career spanned 25 years as a Financial Analyst at Suncor and Manager of Information Systems at BP Resources Canada. After this time Mr.


