S&P Stalls While Gold Sours
Chaos Clinic for 6/14/2019:
This week's Chaos Clinic has three charts: an ephemeris wheel, a chart of the S&P, and a chart of GLD, a gold Exchange Traded Fund.
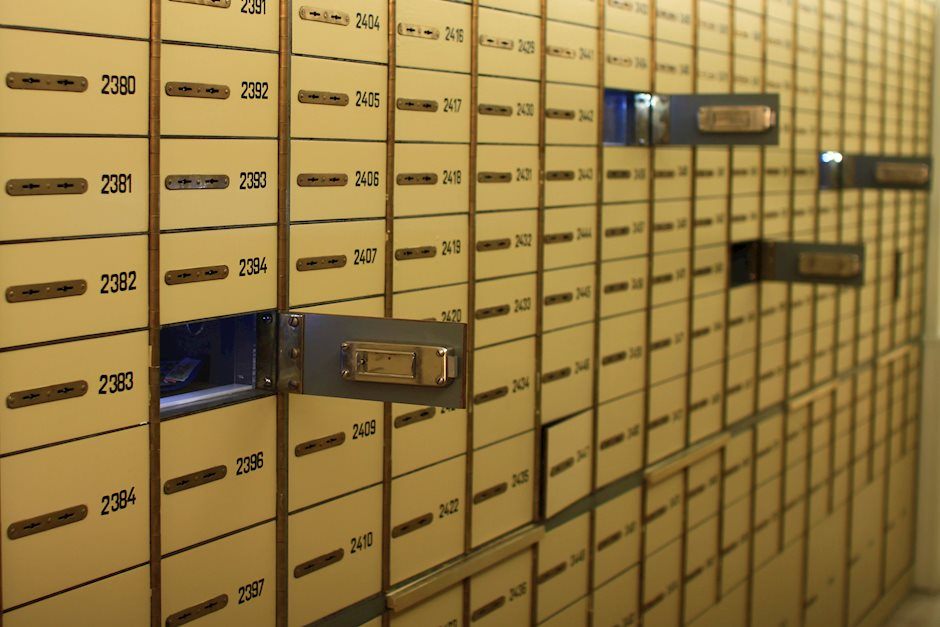
There is a story behind the ephemeris wheel. At 3:30 AM last Saturday morning, I woke up feeling a tremendous amount of energy. I was surprised, because I had gone to bed feeling really tired after a long, hard week. Realizing that I was not going to get back to sleep, and feeling a lot of physical energy (Mars) I decided to plunge into a much deferred deep cleaning of my office. This involves wiping down every book, wire, computer, picture, whatever in my office. I made good progress for many hours. Then it came to mind (Mercury) that maybe I was sensing something in the heavens. I learned many years ago that I am "astro sensitive." I think we all are, but I am built in such a way that I tend to feel energies strongly at times. I've learned that often these same energies show up in the S&P two or three days later.
So I looked at my ephemeris, and discovered I was picking up the forming Earth/Jupiter and Venus/Uranus helio conjunctions. Twelve Earth/Jupiter periods has shown up as my 13 year Air Force and 13 year Bell Labs careers. The Venus/Uranus conjunction was smack on my natal Mars ( that physical energy ) while current Mars was squaring it. No wonder I was charged up. So I was looking for something to happen in the S&P this week.
The wheel shown is for Monday, the 10th. It showed both a square and octagon touching the S&P natal Sun (green H), and natal Venus. Natal Venus conjoined by Neptune was 3/8th ( think Fib) of a circle from Mars. So I was expecting to see a change in the S&P this week, and something harmonic.
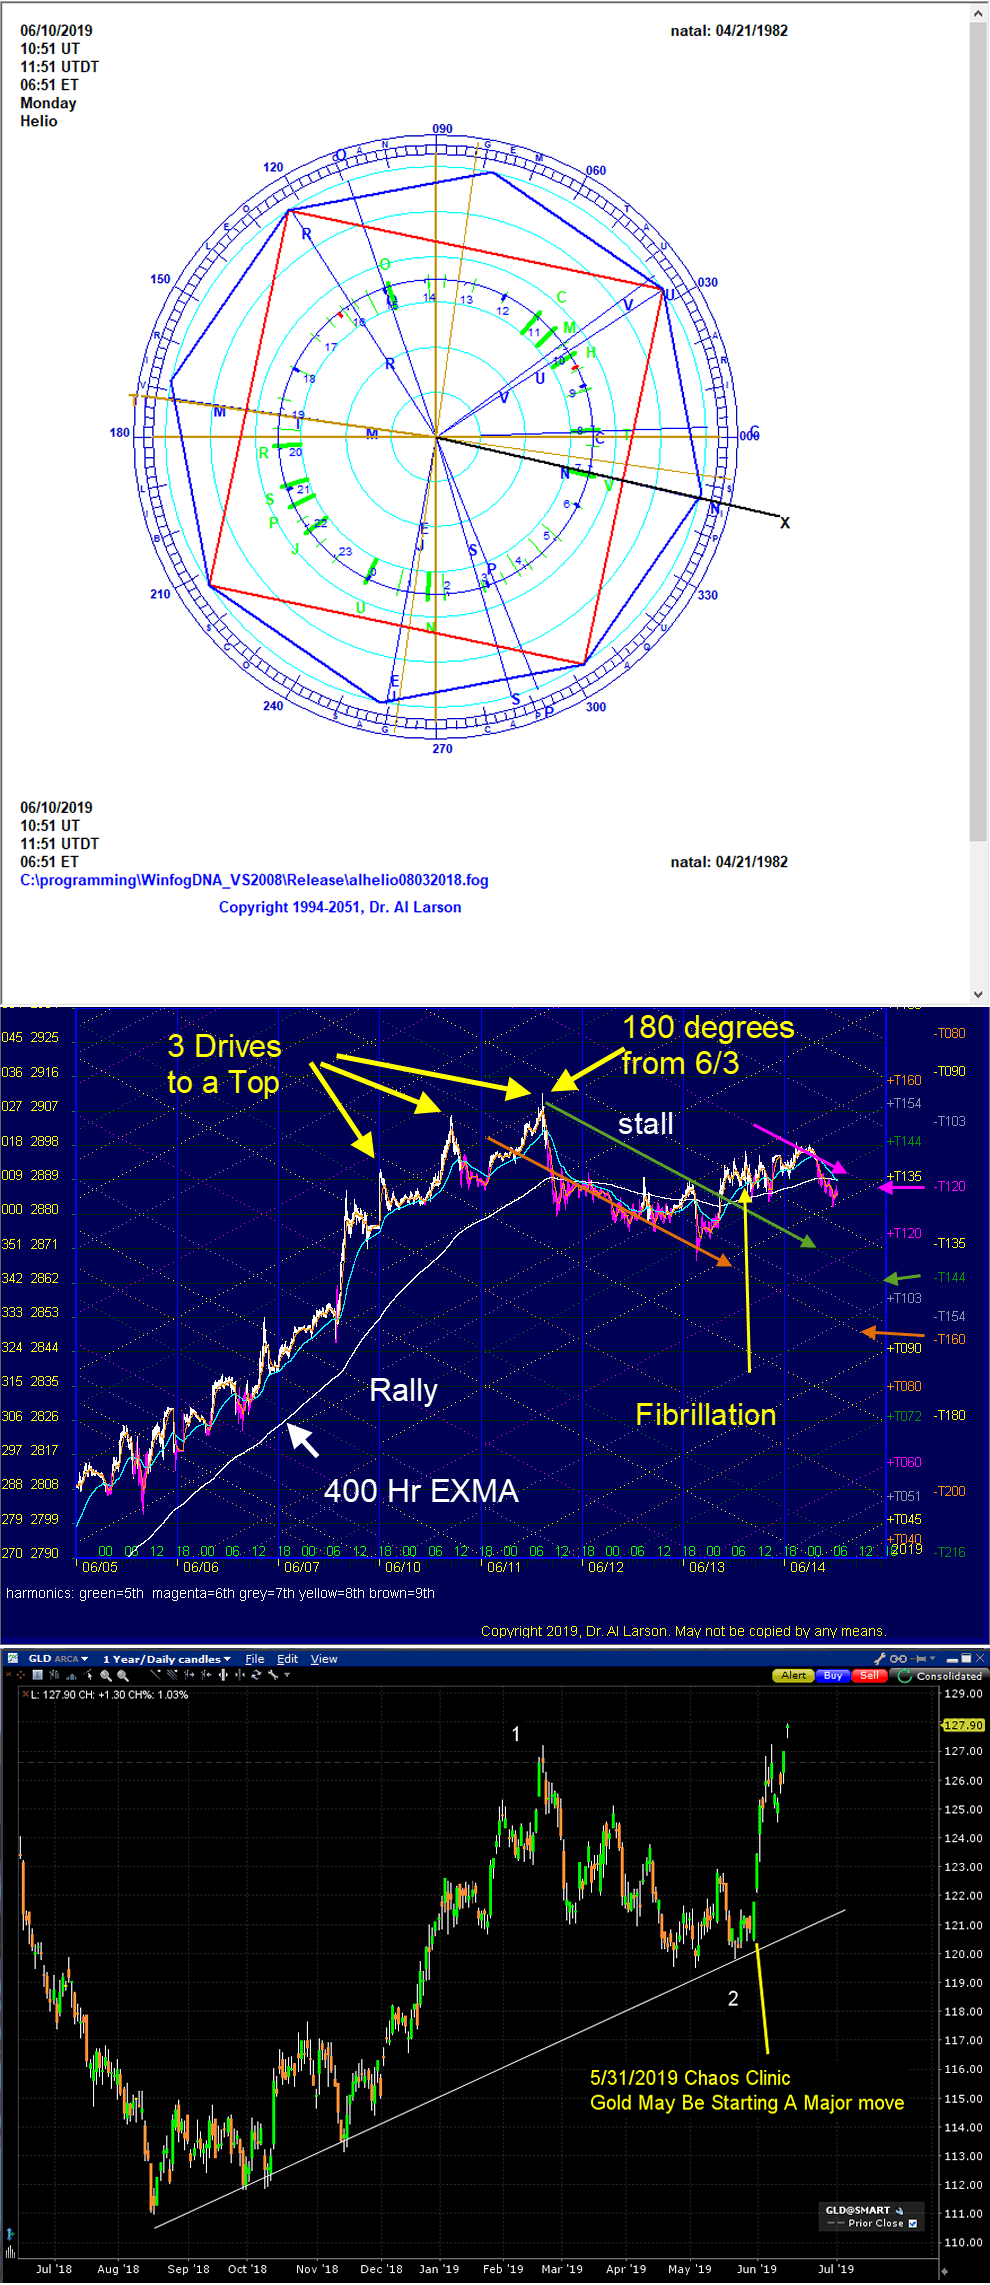
The second chart shows the S&P for this week. There was indeed a change in behavior as the rally up from June 3rd stalled. By early Tuesday, it had formed a classic "three drives to a top." The third top was a very harmonic 180 degrees up from the 6/3/ low. The 400 hour EXMA went flat.
This chart is one of many on http://daytradingforecasts.com, on the SPKISS page. It shows various Moon harmonic flux lines. They suggest downward pressure on the S&P.
Yesterday, Thursday, the S&P made an unusual number of intraday swings. This is fibrillation, a precursor to chaos. Finally, as of now, the weekly candlestick for the the S&P looks like a bearish spinning top. Over the coming weekend, this will studied by longer term investors, and factored into computer trading programs.
The third chart is for the gold exchange traded fund. It has jumped since the 5/31/1019 Chaos clinic. So larger investors are clearly seeking safety.
This content was published on Dr. Al Larson's Chaos Clinic which you can attend each Friday for free.
Dr. Al Larson has developed a complete Chaos Model of Markets, four unique courses that let you become a Certified Chaos Trader, some very unique eMylar fractal pattern overlays, and tools that permit forecasting individual stocks and markets years in advance. You can also sign up for a free weekly email, and attend a free Chaos Clinic on Fridays. To learn more, click on the author's profile.
Be sure to sign up for the free weekly email!
Author

Dr. Al Larson, PhD
MoneyTide.com
Dr. Al Larson holds a Ph.D. in Electrical and Computer Engineering from the University of Wisconsin. He is a 1964 Distinguished Graduate of the U. S. Air Force Academy.


