|

S&P BSE Sensex Index long term bullish cycles and Elliott Wave

The Sensex Index has been trending higher with other world indices. Firstly in it’s base year 1978 to 1979 the index’s point value was set at 100. From there it rallied with other world indices trending higher into the January 2008 highs. It then corrected the bullish cycle as did most other world indices. Furthermore it ended that larger degree correction in October 2008. From those 2008 lows, the index shows a bullish sequence that favors further upside.

Secondly there was a less bullish alternative Elliott Wave count that had a target extension at 46844. This is where a larger black ((I)) could have ended. However price has since went way past there invalidating the thought putting it more in line with other world indices. In this case the Fibonacci extension is measured is as follows. Take a Fibonacci extension tool on a charting platform. Point 1 will be at zero a hypothetical beginning. Point 2 is at the January 2008 cycle high. From there on up to the March 2020 lows will be the point 3. This gives a Fibonacci extension area fifth wave target where the fifth wave would be equal to the wave one where a larger ((I)) could have ended.

As price exceeded the area suggested in that view the momentum indicators also began suggesting this is a huge bullish nested series of wave one’s and two’s. The preferred analysis continues below the chart.

Sensex Index monthly chart

S&P BSE

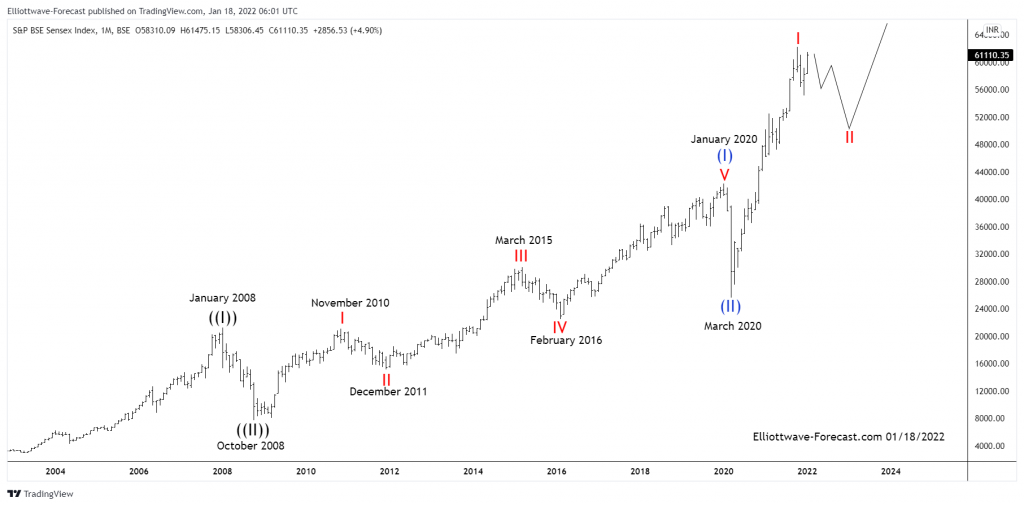
In conclusion the currently favored view in the Sensex index is as shown. It’s showing a nested Elliott Wave bullish cycle. It is in a larger wave ((III)) higher. From the 2008 lows there is a clear five waves up into the January 2020 highs as subdivided on the chart. The pullback in wave (II) into the March 2020 lows was very fast in time however while price is above the March 2020 lows the index should trade higher.

Author

Elliott Wave Forecast Team

Elliott Wave Forecast Team

ElliottWave-Forecast.com

More from Elliott Wave Forecast Team
Share:

Editor's Picks

EUR/USD flirts with daily highs, retargets 1.1900

EUR/USD regains upside traction, returning to the 1.1880 zone and refocusing its attention to the key 1.1900 barrier. The pair’s slight gains comes against the backdrop of a humble decline in the US Dollar as investors continue to assess the latest US CPI readings and the potential Fed’s rate path.

GBP/USD remains well bid around 1.3650

GBP/USD maintains its upside momentum in place, hovering around daily highs near 1.3650 and setting aside part of the recent three-day drop. Cable’s improved sentiment comes on the back of the Greenback’s  irresolute price action, while recent hawkish comments from the BoE’s Pill also collaborate with the uptick.

Gold clings to gains just above $5,000/oz

Gold is reclaiming part of the ground lost on Wednesday’s marked decline, as bargain-hunters keep piling up and lifting prices past the key $5,000 per troy ounce. The precious metal’s move higher is also underpinned by the slight pullback in the US Dollar and declining US Treasury yields across the curve.

Crypto Today: Bitcoin, Ethereum, XRP in choppy price action, weighed down by falling institutional interest 

Bitcoin's upside remains largely constrained amid weak technicals and declining institutional interest. Ethereum trades sideways above $1,900 support with the upside capped below $2,000 amid ETF outflows.

Week ahead – Data blitz, Fed Minutes and RBNZ decision in the spotlight

US GDP and PCE inflation are main highlights, plus the Fed minutes. UK and Japan have busy calendars too with focus on CPI. Flash PMIs for February will also be doing the rounds. RBNZ meets, is unlikely to follow RBA’s hawkish path.

Ripple Price Forecast: XRP potential bottom could be in sight

Ripple edges up above the intraday low of $1.35 at the time of writing on Friday amid mixed price actions across the crypto market. The remittance token failed to hold support at $1.40 the previous day, reflecting risk-off sentiment amid a decline in retail and institutional sentiment.